Figures & data
Table 1. Sequence of primers used for real-time RT-PCR and MSP analysis
Figure 1. Flow cytometric analysis of fresh CB CD34+ enriched cells (A) and ex vivo expanded cells in cytokine liquid culture (B), co-culture system with cytokine (C) and co-culture system without any cytokine (D). Specific staining was performed with anti-CD34-FITC and anti-CD38-PE antibodies. (A) CD34: 94.25%; CD38: 54.63%. (B) CD34: 71.63%; CD38: 67.38%. (C) CD34: 79.48%; CD38: 65.07%. (D) CD34: 77.22%; CD38: 64.42%.
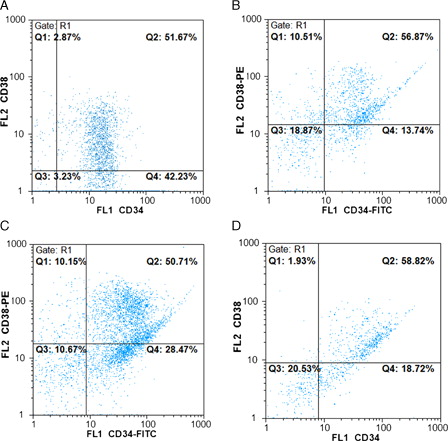
Figure 2. Mean percentage of CD34+/CD38− cells among fresh CB CD34+ isolated cells and expanded cells at day 10 in three culture conditions (n = 5).
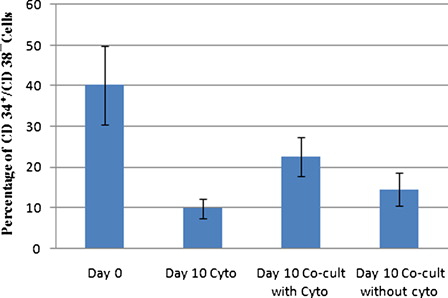
Figure 3. Mean fold change of TNC (A) and CD34+ cells (B) in cytokine liquid culture and in co-culture system with and without cytokine.
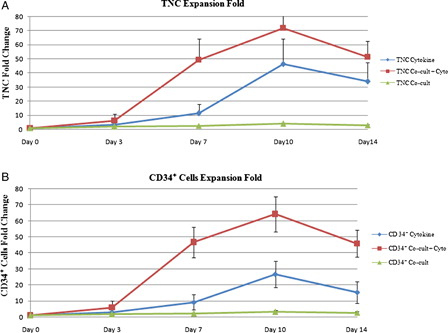
Figure 4. Mean fold increase of CD34+/CD38− cells in cytokine supplemented liquid culture and in co-culture system with and without cytokine on day 10 of expansion in three culture conditions.
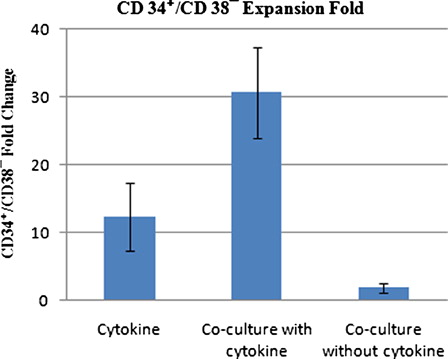
Figure 5. CFU assay of ex vivo expanded hematopoietic cells at day 10 of culture.
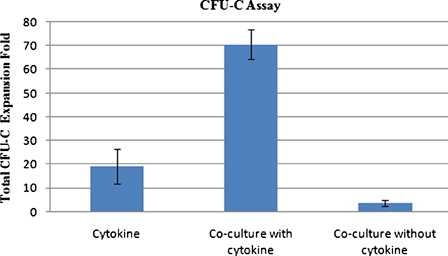
Figure 6. mRNA expression fold changes of p21 (A) and p57 (B) in expanded CD34+ cells relative to fresh CB CD34+ cells in cytokine liquid culture and in co-culture system with cytokine. Data are plotted as mean ± SD of 2−ΔΔCT, which is directly proportional to the relative gene expression.
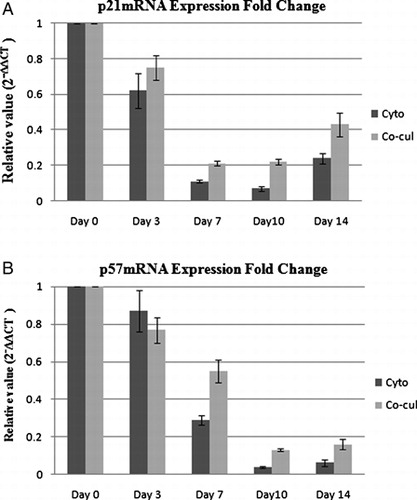
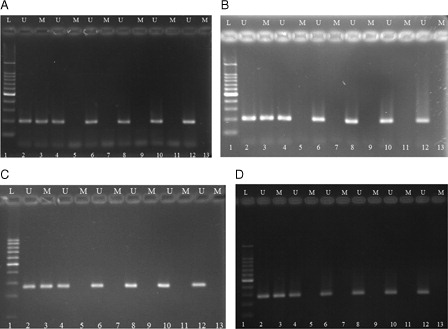
Figure 7. Methylation-specific PCR of bisulfite-modified DNA using primer pairs specific for methylated and unmethylated p21 and p57 genes' promoter sequence. (A, B) representing p21 MSP results and (C, D) representing p57 MSP results for expanded cells in cytokine liquid culture and in co-culture system with cytokine, respectively. M, primers specific for methylated DNA; U, primers specific for unmethylated DNA. 1, DNA ladder; 2, unmethylated DNA control; 3, methylated DNA control; 4, 6, 8, 10, and 12 illustrate DNA amplification at days 0, 3, 7, 10, and 14 of culture, respectively, with unmethylated primers; 5, 7, 9, 11, and 13 had no band indicating lack of DNA amplification for expanded cells at days 0, 3, 7, 10, and 14 of culture, respectively, with methylated primers.