Figures & data
Figure 1. The effect of different concentrations of TEPA on mesenchymal cell viability and toxicity using 72-hour MTT assay. The growth of MSCs in the presence of TEPA 10 µM was significantly higher than other concentrations (*P < 0.05). Data were obtained from duplicate experiments.
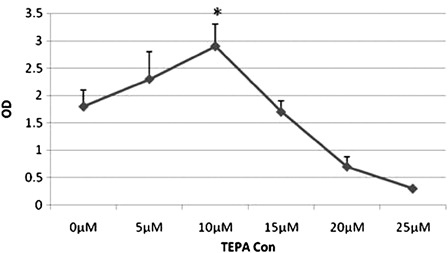
Figure 2. Co-culture of HSCs with MSCs after 10 days expansion in serum-free media supplemented with cytokine cocktail (40×).
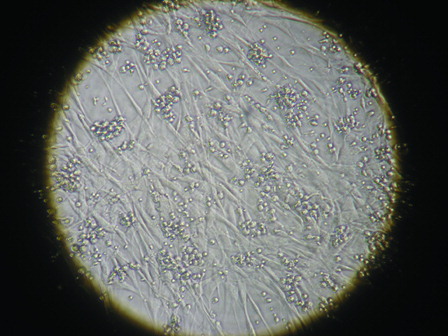
Figure 3. Expansion folds after 10 days in various culture conditions. (A), Expansion fold of TNCs; (B), Expansion fold of CD34+ cells; (C), Expansion fold of CD34+ CD38− cells; and (D), Expansion fold of CFCs. Condition A, supplemented only with the cytokine cocktail; Condition B, supplemented with the cytokine cocktail and BM-derived MSCs; Condition C, supplemented with cytokine cocktail and TEPA; Condition D, supplemented with the cytokine cocktail, BM-derived MSCs as a cell feeder layer and TEPA. Data are expressed as mean ± SD of mean (n = 5); significant differences observed between culture conditions (*P < 0.05).
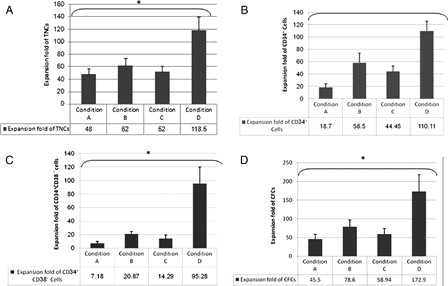
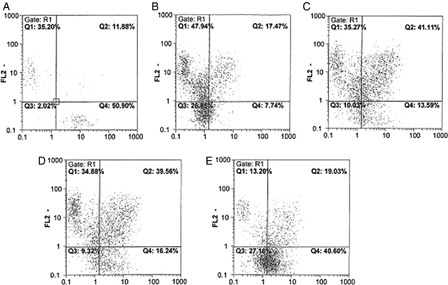
Figure 4. Analysis of CD34 and CD38 expression among HSCs before culture and after 10 days expansion in different culture conditions. FL1: Presented CD34, FL2: Presented CD38 3A, before culture (zero time); 3B, Culture condition A (from fig. 3); 3C, Culture condition B; 3D, Culture condition C; and 3E, Culture condition D.