Figures & data
Figure 1. MACS separated and expanded CD133+ cells detection by flow cytometry. The upper row shows isotype-negative control, the lower row shows CD133- and CD34-positive cells percent. R1 = 98.6%, RN1 = 71.2% = CD34+ cells and RN2 = 94.1% = CD133+ cells.
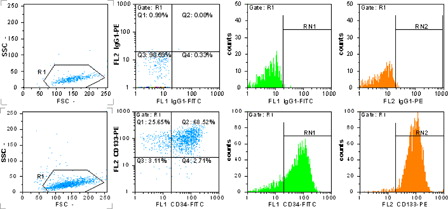
Figure 2. (A) Immunoflourescent microscopic picture of LNA FITC-Scr CD133 +-treated cells. (B) Light microscopic picture of the same cells (Leica, Weltzar, Germany ×100). (C) Flow cytometry analysis of LNA FITC-ScrCD133 +-treated cells, R1 = 97.1%, RN1 = 43.2%.
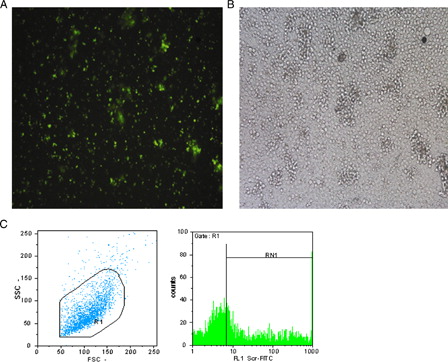
Table 1. The transfected CD133+ cells percentage in different concentration of LNA FITC-scramble
Figure 3. The Mk differentiation of CD133+ Hematopoietic stem cells in different treatments. (A) The mean percentage of CD42/CD61- and CD41-positive cells in days of treatment. (B) Flow cytometric analysis of Mk differentiation detection, the upper row shows TPO-treated cells, R1 = 91.9%, CD42/CD61+ cells = 80.9%, CD41+ cells = 86.8%, the lower row shows anti-miR-10a-treated cells, R1 = 93.28%, CD42/CD61+ = 36.3%, CD41+ cells = 30.1%.
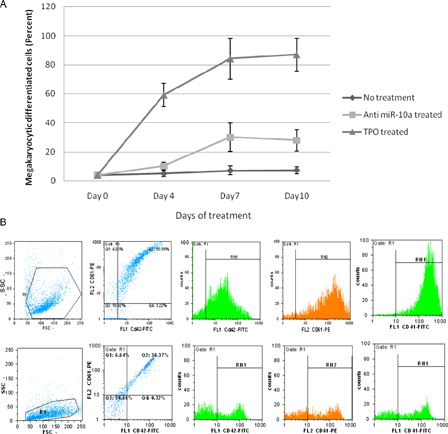
Figure 4. Quantitative real-time PCR. (A) Fold expansion of HOX A1 mRNA in different treatments with respect to CD133+ untreated cells. (B) Fold difference of miR-10a in different treatments with respect to CD133+ untreated cells.
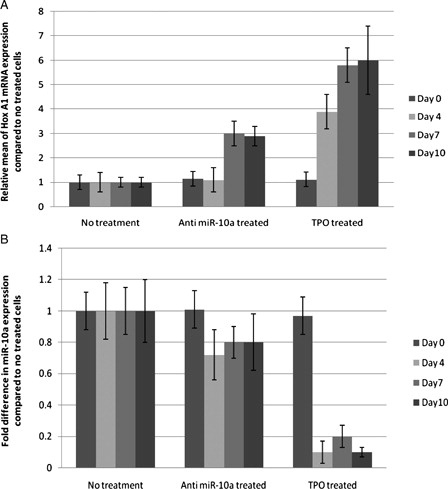
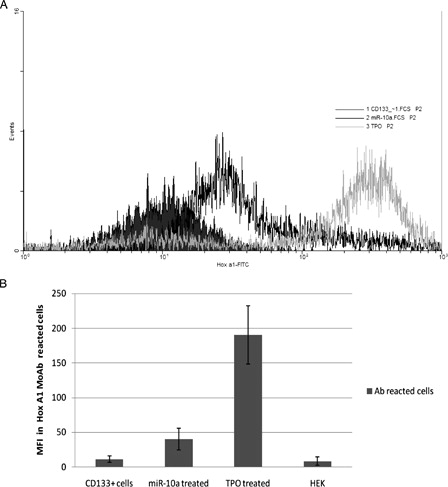
Figure 5. Comparison of MFI in the different treated cells that react by FITC-conjugated Hox A1 MoAb. (A) Flow cytometric analysis overlaid histograms. (B) MFI of reacted cells in no treatment CD133+ cells = 11.2 ± 4.6, anti-miR-10a-treated cells = 40.2 ± 15.4, TPO-treated cells = 190.0 ± 42.1, and in HEK cells as a cell line that expresses the most miR-10a level = 8.2 ± 6.2.