Figures & data
Table 1. Primer Sequences of Genes for PCR Amplification
Table 2. Primer Sequences of BID and BIM Genes for MS-PCR Amplification
Figure 1. RT-PCR results of PcG, BID, and BIM genes in K562 and K562/IMA-3 cell lines. (A) RT-PCR results of the BIM gene: (1) M:50 bp, (2) No DNA, (3) K562 cells, (4) K562/IMA-3 cells, (5) positive control, (6) negative control. (B) RT-PCR results of the EED2 gene: (1) M:50 bp, (2–3) positive control, (4) K-562 cells, (5) K-562/IMA-3 cells, (6) negative control. (C) RT-PCR results of the BID gene: (1) M:50 bp, (2–4) positive control, (5) K562 cells, (6) K562/IMA-3 cells, (7) negative control. (D) RT-PCR results of the SUZ12 gene: (1) M:50 bp, (2) positive control, (3) negative control, (4) K562 cells, (5) K562/IMA-3 cells, (E) RT-PCR results of SIRT1 gene: (1) M:50 bp, (2) K562 cells, (3) K562/IMA-3 cells, (4) positive control, (5) negative control. (F) RT-PCR results of the EZH2 gene: (1) M:50 bp, (2–3) positive control, (4) K562 cells, (5) K562/IMA-3 cells, (6) negative control. (G) RT-PCR results of GAPDH gene: (1) M:50 bp, (2–3) positive control, (4–5) K-562 cells, (6–7) K562/IMA-3 cells, (8) negative control.
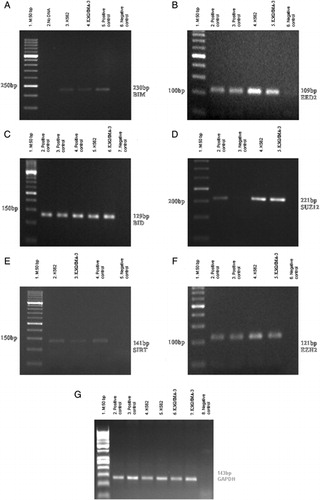
Figure 2. PcG, BID, and BIM genes expressions were determined in K562 and K562/IMA-3 cell lines by real-time RT-PCR.
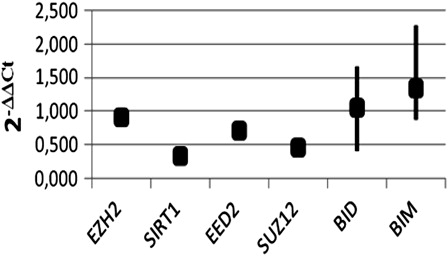
Figure 3. H3K27me3 histone modification on promoter region of BIM and BID genes in K562/IMA-3 cell lines was determined by ChIP-PCR. (A) (1) negative control, (2) positive control, (3) 2% input DNA, (4) M:50 bp, (5–6) K562/IMA-3 cell lines, (7) no DNA. (B) (1) M:50 bp, (2) negative control, (3) positive control, (4) 2% input DNA, (5) K562/IMA-3 cell line, (6) no DNA.
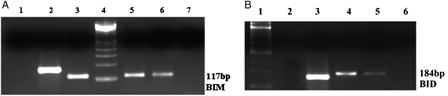
Figure 4. In K562 cell, EZH2 and DNMT1 enzymes were found as bounded to the BID gene promoter region, but in imatinib-resistant K562/IMA-3 cells these enzymes were not seen as bounded to the BID gene promoter. (1) K562 cells BID (+) control, (2) K562 cells BID (−) control, (3) K562 BID 2% input DNA, (4) M: 50 bp, (5) K562 cells EZH2 BID, (6) K562 cells Dnmt1 BID, (7) K562 cells H3K27me3 BID, (8) K562/IMA-3 cells BID (+) control, (9) K562/IMA-3 cells BID (−) control, (10) K562/IMA-3 cells BID 2% input DNA, (11) K562/IMA-3 cells EZH2 BID, (12) K562/IMA-3 cells Dnmt1 BID, (13) no DNA.
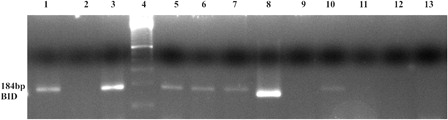
Figure 5. EZH2 and DNMT1 enzymes were determined as bounded to the BIM gene promoter region in both cell lines. (A) (1) K562 cells BID 2% input DNA, (2) K562 cells Dnmt1 BIM, (3) K562 cells EZH2 BIM, (4) K562 cells H3K27me3 BIM, (5) K562 cells BIM (+) control, (6) K562 cells BIM (–) control, (7) M: 100 bp. (B) (1) M: 100 bp, (2) K562/IMA-3 cells BIM 2 % input DNA, (3) no DNA, (4) K562/IMA-3 cells Dnmt1 BIM, (5) K562/IMA-3 cells EZH2 BIM, (6) K562/IMA-3 cells H3K27me3 BIM, (7) K562/IMA-3 cells BIM (+) control, (8) K562/IMA-3 BIM (–) control.
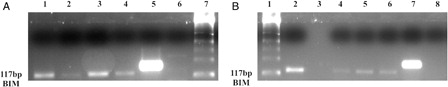
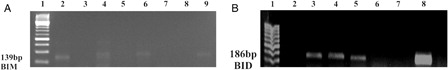
Figure 6. BIM and BID gene promoter regions are unmethylated in K562 and K562/IMA-3 cell lines. (A) (1) M:50 bp, (2) K562 cells BIM unmethylated band, (3) K562 cells BIM methylated sample, (4) K562/IMA-3cells BIM unmethylated band, (5) K562/IMA-3cells BIM methylated sample, (6) peripheral blood sample BIM unmethylated band, (7) peripheral blood sample BIM methylated sample, (8) (+) control BIM unmethylated band, (9) (+) control BIM methylated band. (B) (1) M:50 bp, (2) unmethylated negative control, (3) K562 cells BID unmethylated band, (4) K562 /IMA-3 cells BID unmethylated band, (5) unmethylated positive control, (6), K562 cells BID methylated sample, (7) K562 /IMA-3 cells BID methylated sample, (8) methylated positive control.