Figures & data
Figure 1. Bone marrow hepcidin levels vs. peripheral blood hepcidin levels in MDS patients. There was no significant difference between bone marrow hepcidin levels and peripheral blood hepcidin levels in MDS patients (P = 0.134).
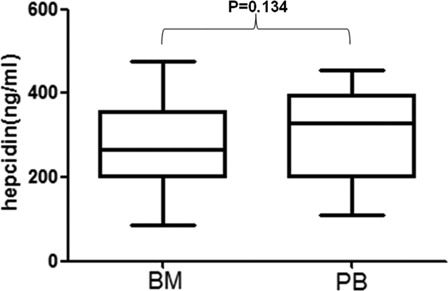
Table 1. Characteristics of MDS patients and controls
Table 2. Characteristics of MDS patients stratified according to WHO subtypes
Table 3. Characteristics of MDS patients stratified according to IPSS and WPSS
Table 4. Transfusion-dependent patients vs. transfusion-independent patients
Figure 2. The expression levels of hepcidin in CD4+ lymphocytes and CD19+ lymphocytes in non-transfusion-treated MDS patients. The expression level of hepcidin in CD4+ high-expression group is higher than the normal-expression group. Statistical difference has been found (P = 0.02). There is no significant difference between CD19+ high-expression group and normal-expression group (P = 0.206).
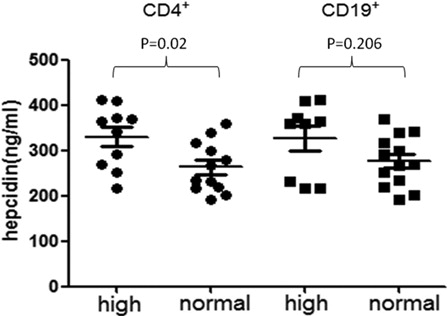
Figure 3. Hepcidin levels in T-cell polarization of Th1/Th2 in non-transfusion-treated MDS patients. There is a significant difference between Th1/Th2 > 70.6 group and Th1/Th2 ≦ 70.6 group (P < 0.001). If the ratio of Th1/Th2 is over 70.6, it is considered that the patient has a Th1 polarization trend.
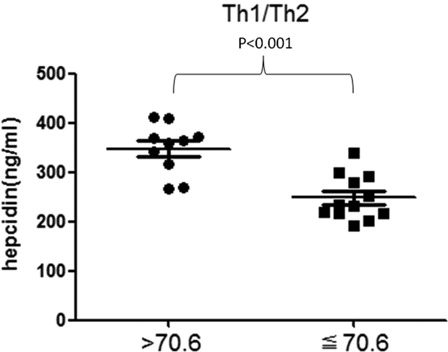
Figure 4. The MRI T2* images of one MDS patient whose SF < 1000 µg/l. The MRI T2* images of one MDS patient whoseSF < 1000 µg/l. The patient's SF value is 897 µg/l, but his LIC is 17.56 mg/g dry weight which means severe iron overload.
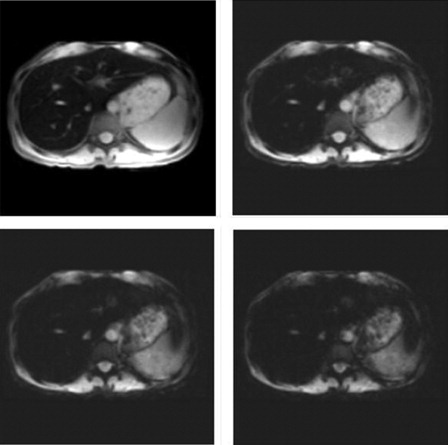
Table 5. Linear regression model of hepcidin predictors in MDS patients