Figures & data
Figure 1. Amplification plots of MN1 gene and GAPDH using real-time PCR. Real-time analysis of MN1 gene expression; the comparative CT method was used to determine the relative expression levels of MN1, and the cycle number difference (ΔCT = CT MN1 − CT GAPDH) was calculated for each sample. Relative MN1 expression values are expressed as 2 (ΔCT).
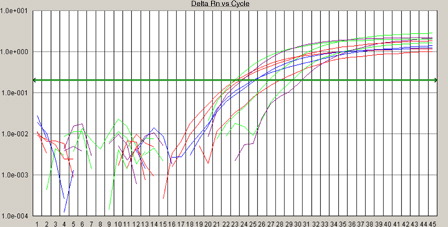
Table 1. AML patients characteristics according to MN1 expression status
Table 2. Interrelation between NPM1 and FLT3-ITD mutations and MN1 expression
Table 3. Comparison between high and low expression of MN1 as regards to AML patients outcome
Figure 2. Kaplan–Meier curve for DFS in CN-AML patients according to MN1 expression.
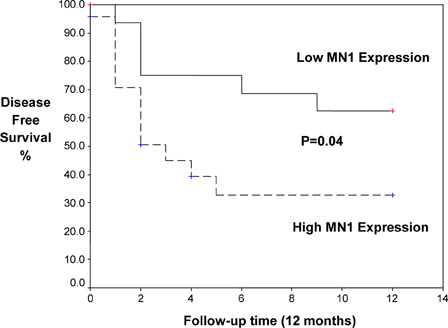
Figure 3. Kaplan–Meier curve for OS in CN-AML patients according to MN1 expression.
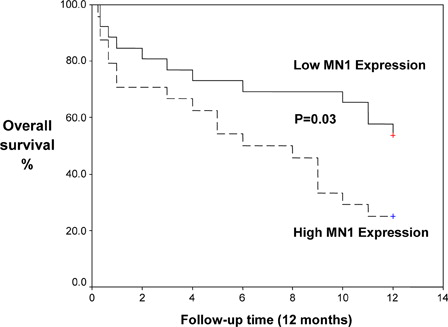
Table 4. Odds ratio assessment in patients with higher MN1 expression as compared with those with lower expression
Table 5. OS and DFS as dependent parameters studied with other covariates (multivariate analysis)