Figures & data
Table 1. Cytogenetic responses at 12 and 18 months after initiation of imatinib and last follow-up for all patients
Figure 1. Frequency of BCR/ABL transcripts. Three patients were negative for BCR-ABL transcripts because complete molecular response.
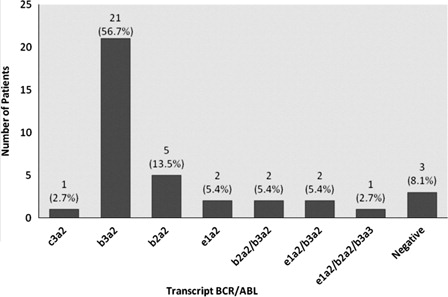
Table 2. Demographic characteristics of b3a2 transcript group and other transcript group
Figure 2. Overall survival for both groups.
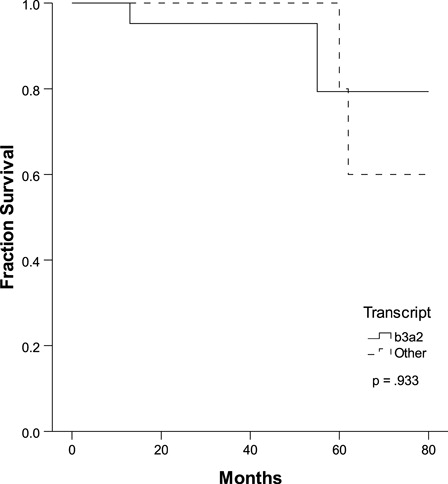
Table 3. Cytogenetic responses at 12 and 18 months and last follow-up for both groups