Figures & data
Table 1. Sequences and length of designed primers for HPA-1, -3, -5 and the two internal positive control primers
Figure 1. Examples of amplification in HPA-1a system. The upper band corresponds to the amplification product of the CRP gene (internal control of 440 bp). The lower band corresponds to the amplification product of HPA-1a gene (189 bp) situated between 123 and 246 bp bands of molecular weight markers.Lane1: negative control; lanes 2, 3, 4, 6, and 7: individuals with HPA-1a allele; lane 5: individual without HPA-1a allele; lane 8: molecular weight marker of 123 bp.
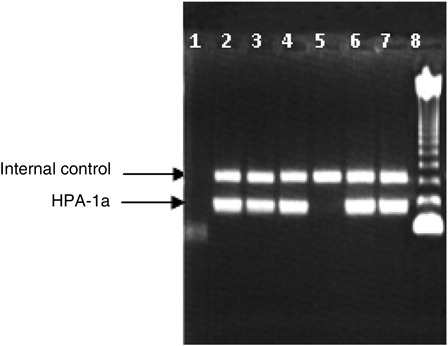
Table 2. Genotype frequencies of HPA-1, -3, and -5
Table 3. Frequencies of HPA alleles in different ethnic groups