
Figures & data
Table 1. Clinical and laboratory data
Figure 1. (A) Levels of PTX3 are comparable in normal controls and stable SCD patients, whereas they are significantly increased in VOC (P < 0.01). (B) Levels of CRP are increased in stable SCD compared to controls (P < 0.01), with a further increment in VOC (P < 0.01). The box and whisker plots show in the box the median and the 25th and 75th percentile; whiskers show the 2.5th and 97.5th percentile.
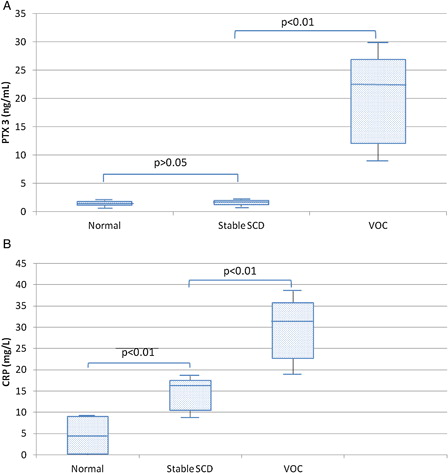
Table 2. Relation of PTX3 and CRP levels to development of ACS and Hb variant
Figure 2. PTX3 levels are significantly increased in the second sample of patients who developed ACS compared to their first sample at the time of VOC diagnosis (*P < 0.01 compared to sample 1). Bars represent mean ± SD.
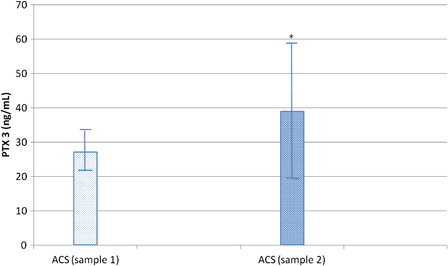
Figure 3. PTX3 level was significantly increased in ventilated ACS patients in sample 1 (*P = 0.01 compared to non-ventilated patients) and sample 2 (**P = 0.0002 compared to non-ventilated patients). Bars represent mean ± SD.
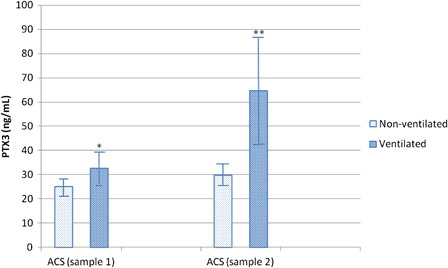
Table 3. Correlation of PTX3 level to laboratory data, PaO2/FiO2, and hospital stay in stable SCD, VOC, and ACS patients