Figures & data
Table 1. HBB genotypes of the 10 control DNA samples used to set up the HRMA assay
Table 2. PCR primers used in HRMA
Figure 1. Optimization of HRMA. (A) High-resolution melting curves and (B) difference plots with redesigned new primer set (P5/BEX2R-A). In the temperature-shifted difference plots, a wild-type control was used to normalize melting profiles of the other samples against this predefined horizontal baseline (violet curve). HRM can easily distinguish the two frequent Tunisian HBB mutations and heterozygous genotype from homozygous genotypes for each mutation.
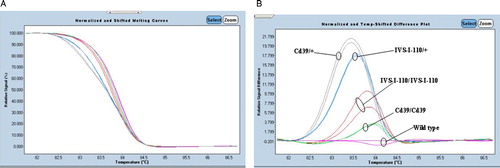
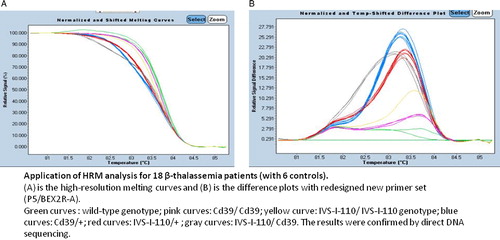
Figure 2. Application of HRM analysis for 12 patients with β-thalassemia. (A) High-resolution melting curves and (B) difference plots with redesigned new primer set (P5/BEX2R-A). Blue curves represent wild-type HRM profiles. The results were confirmed by direct DNA sequencing.
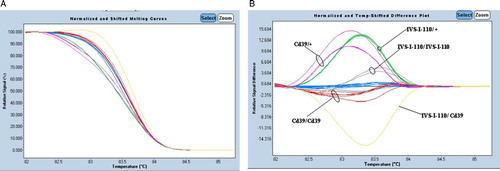
Table 3. List of 12 HBB genetic variants identified by HRM analysis and confirmed by direct sequencing