580
Views
11
CrossRef citations to date
0
Altmetric
HEMATOLOGICAL MALIGNANCY

D-index dose not predict the development of pulmonary infection in acute myeloid leukemia patients undergoing consolidation chemotherapy with high-dose cytarabine

, , , , , , , , , , , , , , , , , & show all

Figures & data

Figure 1. D-index in each chemotherapy cycle (A) and total neutropenia indexes (B) of a hypothetical patient. (A) D-index in each chemotherapy cycle. If the duration of neutropenia is 11 days, the expected neutrophil area (shaded area, Ae) is 11 × 500 = 5500. If the area under the neutrophil curve calculated by the trapezoidal method (striped area, Ao) is 1085, the D-index = 5500 − 1085 = 4415. (B) Total neutropenia indexes; total D-index of whole consolidation chemotherapy (CTx) cycles, total D-index from induction to consolidation CTx, and total c-D-index from induction to consolidation CTx.

Figure 1. D-index in each chemotherapy cycle (A) and total neutropenia indexes (B) of a hypothetical patient. (A) D-index in each chemotherapy cycle. If the duration of neutropenia is 11 days, the expected neutrophil area (shaded area, Ae) is 11 × 500 = 5500. If the area under the neutrophil curve calculated by the trapezoidal method (striped area, Ao) is 1085, the D-index = 5500 − 1085 = 4415. (B) Total neutropenia indexes; total D-index of whole consolidation chemotherapy (CTx) cycles, total D-index from induction to consolidation CTx, and total c-D-index from induction to consolidation CTx.

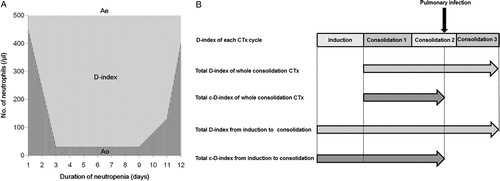
Table 1. Clinical and epidemiological characteristics of the study patients

Figure 2. D-index of induction and consolidation chemotherapy cycles. The bar graph shows the average of the D-index of induction and consolidation chemotherapy cycles, and error bars indicate the standard deviation around the mean. C1, first cycle of consolidation chemotherapy; C2, second cycle of consolidation chemotherapy; C3, third cycle of consolidation chemotherapy.

Figure 2. D-index of induction and consolidation chemotherapy cycles. The bar graph shows the average of the D-index of induction and consolidation chemotherapy cycles, and error bars indicate the standard deviation around the mean. C1, first cycle of consolidation chemotherapy; C2, second cycle of consolidation chemotherapy; C3, third cycle of consolidation chemotherapy.

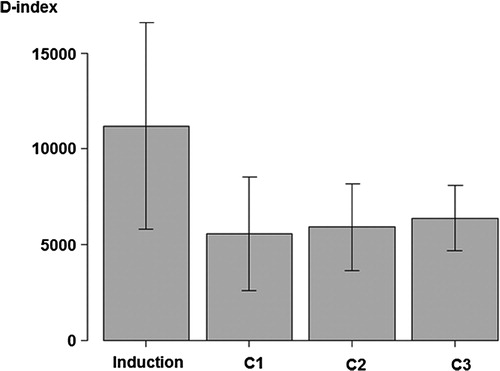
Table 2. Neutropenia indexes

Reprints and Corporate Permissions

Please note: Selecting permissions does not provide access to the full text of the article, please see our help page How do I view content?

To request a reprint or corporate permissions for this article, please click on the relevant link below:

Academic Permissions

Please note: Selecting permissions does not provide access to the full text of the article, please see our help page How do I view content?

Obtain permissions instantly via Rightslink by clicking on the button below:

If you are unable to obtain permissions via Rightslink, please complete and submit this Permissions form. For more information, please visit our Permissions help page.