Figures & data
Figure 1. T2-weighted (A) and post-contrast T1-weighted (B) brain MR images in the axial plane shows a right parietal mass lesion, with ring enhancement and peripheral edema. Apparent diffusion coefficient map (C) generated from diffusion-weighted study performed at the same anatomic level depicts diffusion restriction, reflecting the highly viscous content, consistent with abscess.
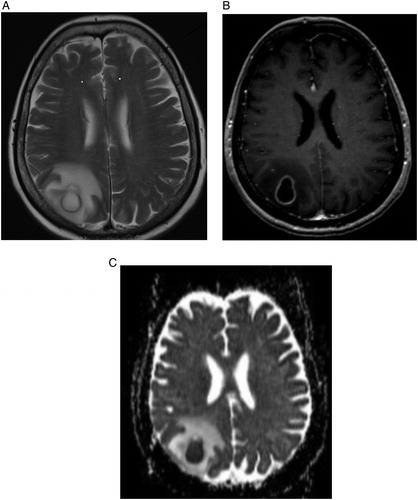
Figure 2. Gram stain of the culture material showing beaded, branching filamentous gram-positive bacilli.
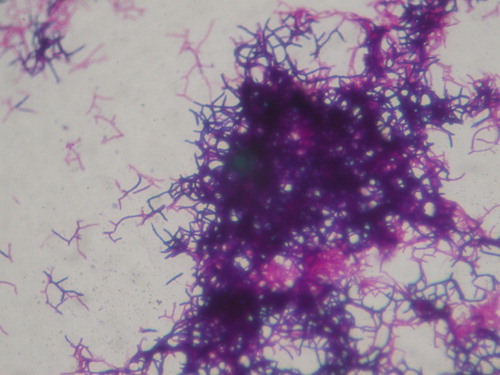
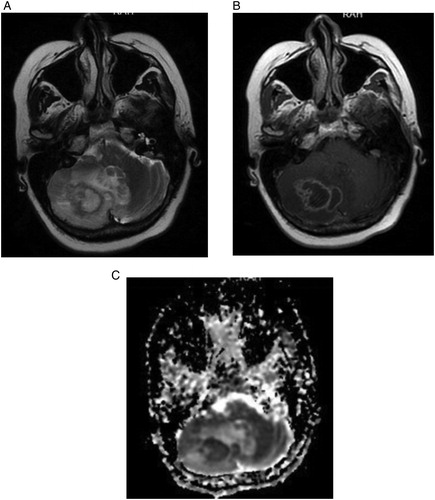
Figure 3. T2-weighted (A) and postcontrast T1-weighted (B) brain MR images in the axial plane shows a right cerebellar mass lesion, with peripheral enhancement and accompanying edema causing mild midline shift. Apparent diffusion coefficient map (C) generated from diffusion-weighted study performed at the same anatomic level depicts diffusion restriction, enabling the diagnosis of an abscess.