464
Views
1
CrossRef citations to date
0
Altmetric
Acute Myeloid Leukemia

Quantitative assessment of BAX transcript and flow cytometric expression in acute myeloid leukemia: A prospective study

, , , , , , & show all

Figures & data

Figure 1. RQ PCR for assessment of the BAX transcripts in AML patients. (A) Amplification curves for 2 AML patients with the standard of known concentration and negative control. (B) Standard curve for the quantification of the BAX transcript.

Figure 1. RQ PCR for assessment of the BAX transcripts in AML patients. (A) Amplification curves for 2 AML patients with the standard of known concentration and negative control. (B) Standard curve for the quantification of the BAX transcript.

Figure 2. Flow cytometry-based assessment of the BAX protein in AML patients. (A) Gating of the myeloblasts on the basis of the CD 45 expression. (B) BAX isotype control on the gated myeloblasts used to demarcate the negative selection. (C) BAX expression on the gated myeloblasts. (D) MFI of the BAX isotype control. (E) MFI of the BAX on the gated myeloblasts.

Figure 2. Flow cytometry-based assessment of the BAX protein in AML patients. (A) Gating of the myeloblasts on the basis of the CD 45 expression. (B) BAX isotype control on the gated myeloblasts used to demarcate the negative selection. (C) BAX expression on the gated myeloblasts. (D) MFI of the BAX isotype control. (E) MFI of the BAX on the gated myeloblasts.

Table 1. Patients characteristics

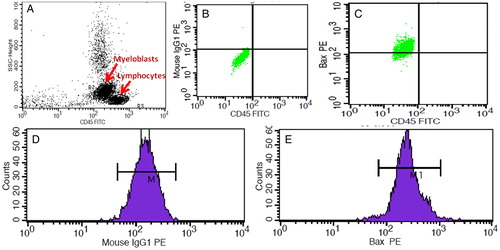
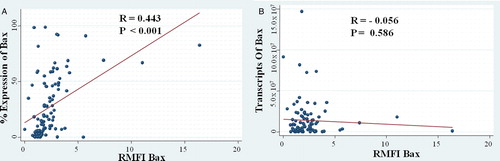
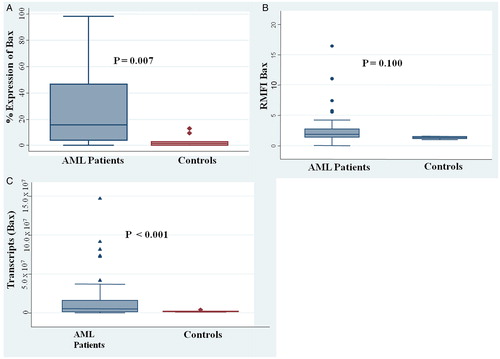
Table 2. Expression of the BAX cytoplasmic protein (percentage and relative median fluorescence intensity RMFI by flow cytometry) and transcript (Q PCR)

Figure 3. (A) Correlation of the BAX percentage expression with the RMFI. (B) Correlation of the BAX transcripts expression with the protein expression.

Figure 3. (A) Correlation of the BAX percentage expression with the RMFI. (B) Correlation of the BAX transcripts expression with the protein expression.

Figure 4. Box plots (A) Comparison of the percentage BAX expression of the AML patients with control. (B) Comparison of the RMFI of the BAX of the AML patients with control. (C) Comparison of the BAX transcripts of the AML patients with control.

Figure 4. Box plots (A) Comparison of the percentage BAX expression of the AML patients with control. (B) Comparison of the RMFI of the BAX of the AML patients with control. (C) Comparison of the BAX transcripts of the AML patients with control.

Table 3. Correlation of the BAX transcript expression with the baseline patient characteristics

Table 4. BAX expression (transcript level, more than or less than the median) with the remission and the outcome

Table 5. Studies of the BAX expression and their impact on the clinical outcome

Reprints and Corporate Permissions

Please note: Selecting permissions does not provide access to the full text of the article, please see our help page How do I view content?

To request a reprint or corporate permissions for this article, please click on the relevant link below:

Academic Permissions

Please note: Selecting permissions does not provide access to the full text of the article, please see our help page How do I view content?

Obtain permissions instantly via Rightslink by clicking on the button below:

If you are unable to obtain permissions via Rightslink, please complete and submit this Permissions form. For more information, please visit our Permissions help page.