Figures & data
Table 1. Summary statistics (mean ± SD) for the red cell indices for normal controls, and patient groups (HS and thalassemia)
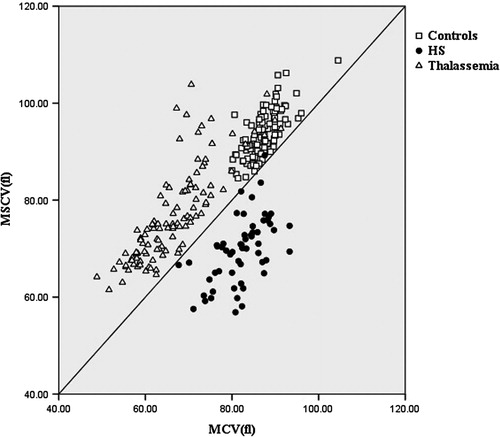
Figure 1. Scatter plot for mean sphered cell volume (MSCV) vs. mean cell volume (MCV) for normal controls (n = 107) and patient groups, hereditary spherocytosis (HS) (n = 57) and thalassemia (n = 109).