
Figures & data
Figure 1. Histograms of the negative control samples for FITC- (A) and PE- (B) labeled isotypic antibodies. B-line was drawn to exclude non-specific signals released by FITC negative control. C-line was drawn to exclude non-specific signals released by PE negative control. (C) shows that all particles were presented in quadrant 3 (negative signals for both FITC- and PE-labeled isotypic antibodies.
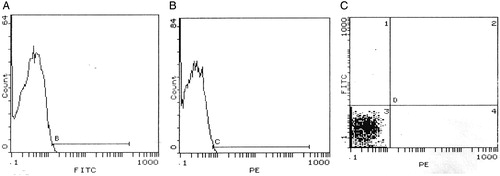
Figure 2. Histograms of flow cytometry show a case positive for both CD31 (A) and CD42b (B). (C) represents a four-quadrant histogram to detect co-expression of both markers (quadrant 2), i.e. PMP, while quadrant 1 represents MPs positive only for CD31, i.e. EMPs.
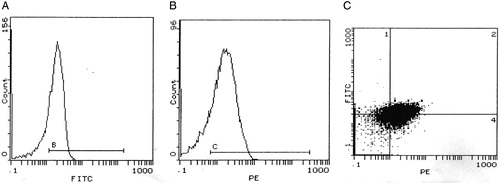
Table 1. Showing demographic and laboratory data of the three groups
Table 2. Results of blood pressure and albumin of the three groups
Table 3. Neonatal outcome of the three studied groups
Table 4. EMPs and PMPs count in the three studied groups