
Figures & data
Figure 1. Distribution of BMEs according to the age of infant at the time of procedure.
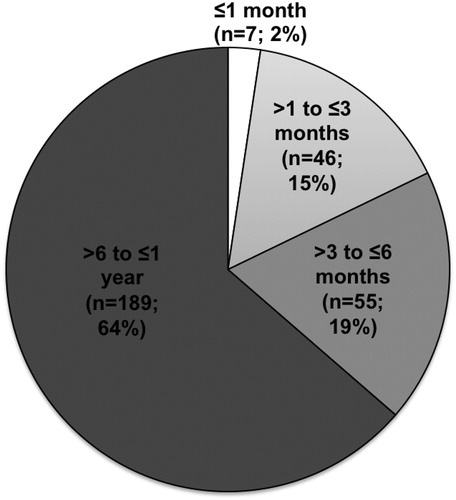
Figure 2. Year wise distribution of infant BMs.
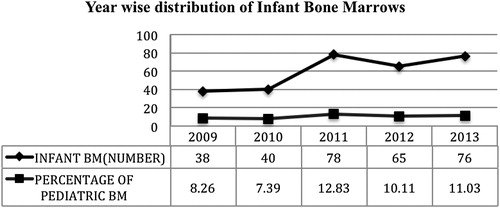
Table 1. Indications for BME (N = 297)
Figure 3. Comparison of clinical indications of BME among various age groups in infants.
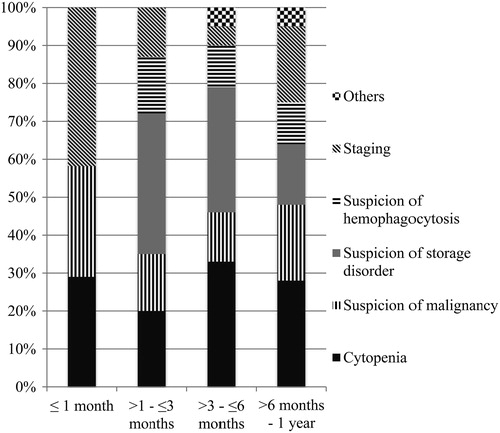
Table 2. Diagnoses offered on morphological evaluation of BM samples