Figures & data
Table 1. Clinical characteristics of eight HD patients with transfusional iron overload receiving iron chelation therapy with DFX
Table 2. Comparison of the effect of DFX in HD patients with iron overload
Table 3. Metabolic changes of iron regulation and response of hematopoiesis before and after administration of DFX in HD patients with iron overload
Figure 1. Percentage of the change of serum ferritin level after DFX treatment over time.
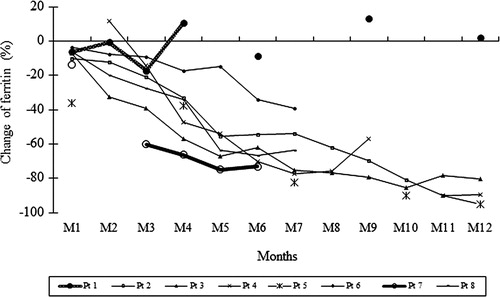
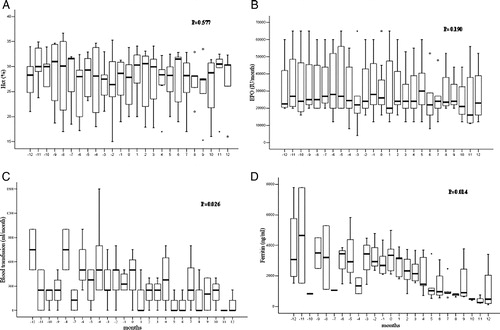
Figure 2. Change in (A) hematocrit (Hct), (B) average EPO dosage, (C) average blood transfusion, and (D) serum ferritin level monthly before and after DFX treatment analyzed with GEE model. Note: The boxes represent the 25th and 75th percentiles, while the whiskers correspond to the 10th and 90th percentiles. The medians are connected.