Figures & data
Table 1. Clinical and biological characteristics of the participants
Table 2. Primers for qRT-PCR
Table 3. Characteristics of the mutation pattern of DNMT3A mutants
Figure 1. Comparing total DNMT3A gene expression level between patients, cytogenetic risk subgroups, and normal control. It is worth mentioning that normal control RNA was extracted from peripheral blood.
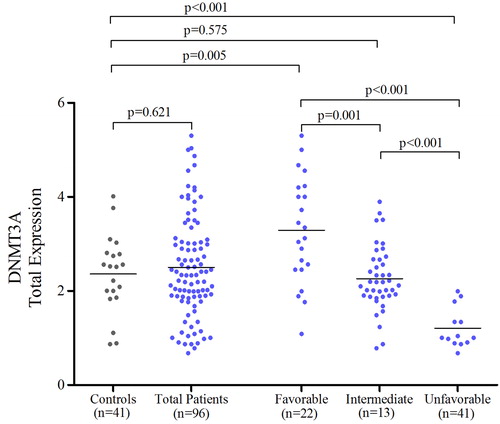
Figure 2. Comparing DNMT3A transcript 2 expression level between total patients, three cytogenetic risk subgroups, intermediate-mutant, intermediate-wild type, and normal control, from left to the right, respectively. It is worth mentioning that normal control RNA was extracted from peripheral blood.
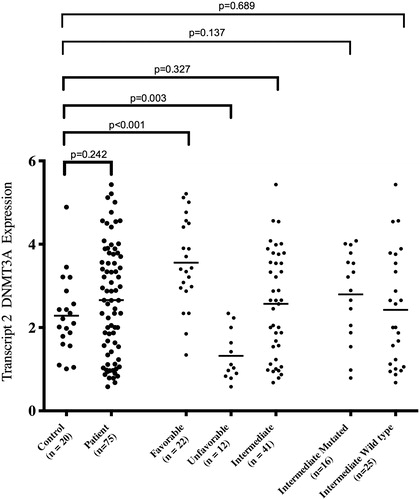
Figure 3. OS and RFS in total patients, Kaplan–Meier survival curves for OS and RFS in total AML patients (A and B) who received standard intensive chemotherapy.
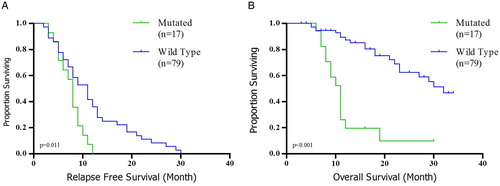
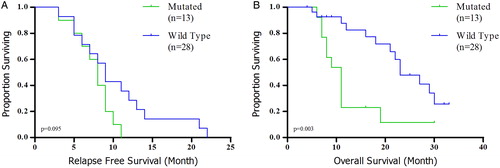
Figure 4. Kaplan–Meier survival curves according to DNMT3A in intermediate subgroup. (A) OS and (B) RFS.