Figures & data
Figure 1. Regions of interests (ROIs) were selected semi-automatically using image processing software. BG: basal ganglia, CSF: cerebrospinal fluid.
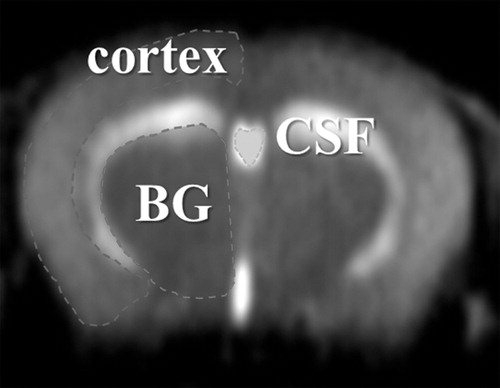
Figure 2. Decay curve fitting. Intensities at the steady state of each area, expressed as% against the averaged intensity of identical pixel prior to administration of H217O, were determined by fitting their time course using the function: I = I0(1 − ae−bt). I0 denotes the normalized signal intensity at infinite time (t = ∞) calculated from the fitted curve.
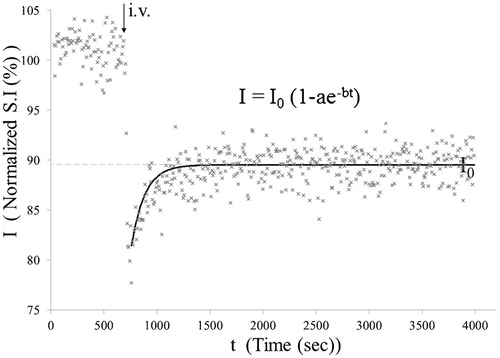
Figure 3. Representative time course. Representative time course of signal intensities within pixels of each region of interest (ROI) shown in following intravenous H217O administration in transgenic (APP-PS1) and age-matched wild-type (WT) mice. Blue: cortex, red: basal ganglia (BG), green: cerebrospinal fluid (CSF) within the third ventricle. Each dot represents the intensity of each pixel within the ROI.
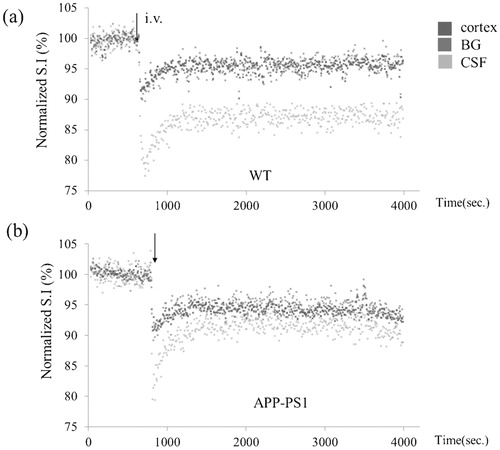
Figure 4. I0 of three ROIs. Values of I0 in cortex and basal ganglia (BG) are virtually identical between APP-PS1 and WT mice. In contrast, I0 of CSF within the third ventricle is significantly higher in APP-PS1 mice. For comparison, previously reported values of aquaporin-4 (AQP-4) knock out mice are shown together. *P < 0·05. WT, wild type; APP-PS1, APP-PS1 transgenic; AQP4(−/−), AQP4 knockout.
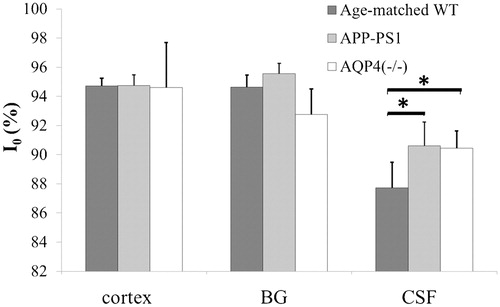
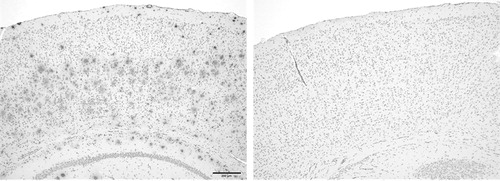
Figure 5. Beta-amyloid immunohistology of APP-PS1 transgenic (left) and control (right) mice.