Figures & data
Table 1. Chemical composition of steel Fe–0·80C/wt-%
Table 2. Experimental details and results of experiments with varying cooling rates
Table 3. Experimental details and results of experiments with varying austenitising treatments*
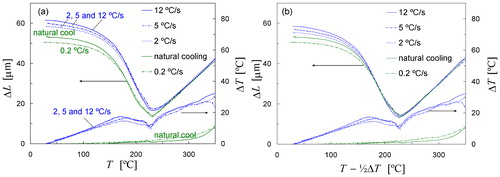
1. a measured dilatation as a function of temperature due to martensite formation during cooling of Fe–0·80 samples with different rates. Right-hand y-axis shows measured temperature difference between two thermocouples (ΔT) and b dilatometry data plotted against temperature corrected for thermal gradients
2. a dilatation due to tempering of fully martensitic sample at 180°C as a function of time: length decrease of about 2–2·5 μm in some tens of seconds and b dilatation as a function of temperature showing tempering characteristics during heating of samples which were made martensitic with different cooling rates as shown in
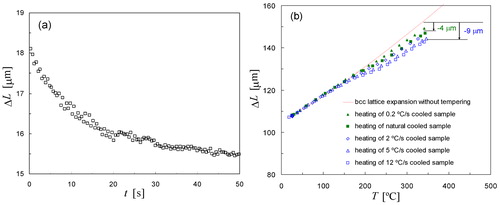
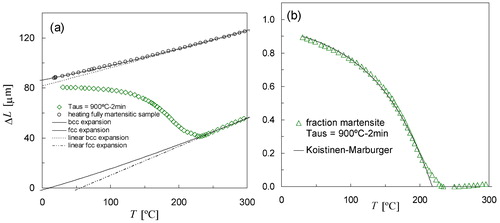
3. a measured dilatation as a function of temperature due to martensite formation during natural cooling (open squares). Solid lines represent thermal expansion of both austenite (fcc) and martensite (bcc); open circles describe dilatation of fully martensitic sample during heating and b experimental volume fraction of martensite as a function of temperature derived from Fig. 3a (open squares) can be described by KM equation (solid line) using TKM = 218°C, αm = 0·0122 K−1. Volume fraction of retained austenite at room temperature is approximately 0·10
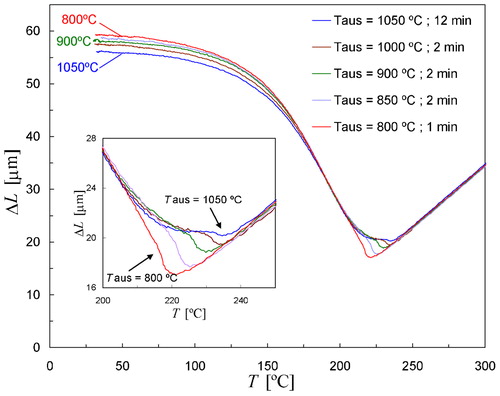
4. Change in length as a function of temperature due to martensite formation in Fe–0·80C during natural cooling of samples which were given different austenitising treatments. Inset shows magnification of dilatometry curves close to Ms temperature
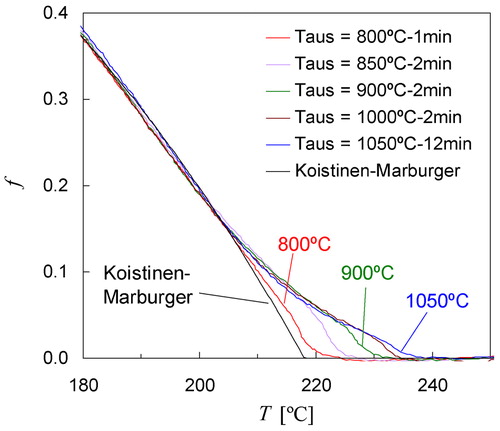
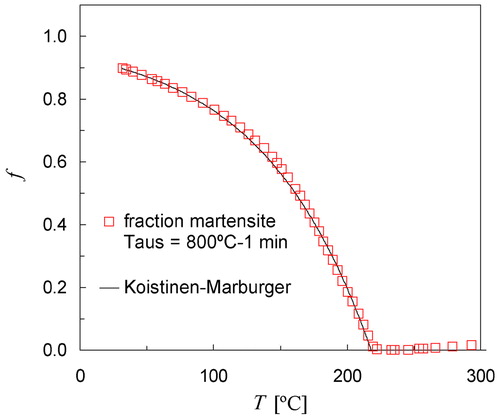
5. Volume fraction of martensite as a function of temperature derived from measured dilatation data shown in for Taus = 800°C (open squares). Solid line represents progress of transformation calculated with KM equation using TKM = 218°C, αm = 0·0122 K−1
6. Martensite fraction as a function of temperature corresponding measured dilatation signals shown in inset of . Black line represents transformation kinetics calculated with KM equation using TKM = 218°C, and αm = 0·0122 K−1