
Figures & data
Table 1. Compositions of three hot rolled strips/wt-%
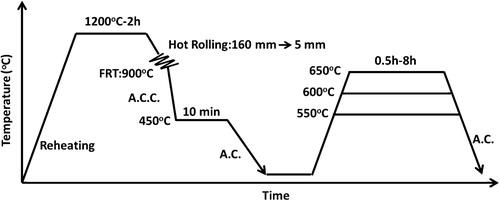
1. Schematic diagram of thermomechanical process with tempering treatments for strips Nb, Nb–Mo and Nb–3Mo
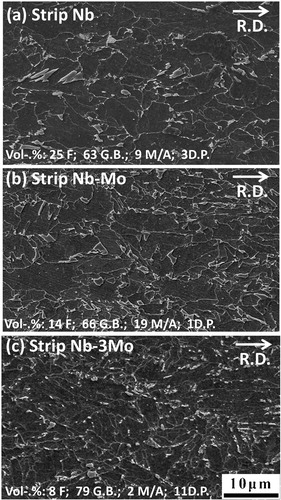
2. Scanning electron micrographs showing as received microstructures in a strip Nb, b strip Nb–Mo and c strip Nb–3Mo (R.D., rolling direction)
3. Typical TEM images showing a ferrite with interior strain induced Nb carbides and b granular bainite in strip Nb–3Mo
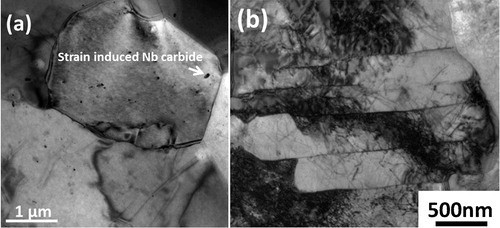
Table 2. Volume percentage of phases in three hot rolled strips*
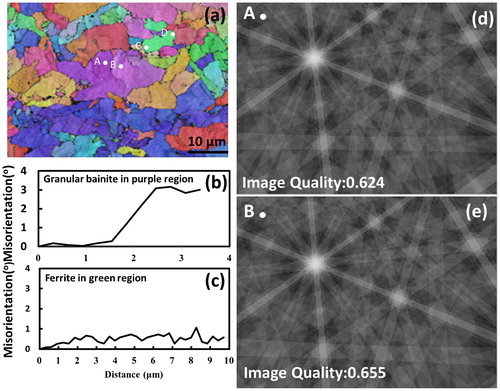
4. a electron backscatter diffraction map of strip Nb, b gradient of misorientation from point A to B in purple region, c gradient of misorientation from point C to point D in green region and d, e corresponding simulated Kikuchi patterns at points A and B in a
5. Misorientation angle profiles for strips Nb, Nb-Mo and Nb-3Mo
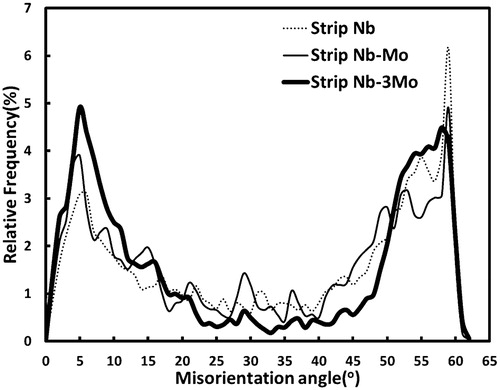
Table 3. List of 24 axis angle pairs for adjacent grains A and B
6. a substructure of tempered granular bainite in strips Nb with tempering at 600°C for 1 h, b distribution of nanometre sized carbides located at given dislocation lines in enlarged region of a with dashed white frame, c Moiré fringes of nanometre sized carbides, indicated by arrows in enlarged region of b with dashed white frame and d corresponding FFT image of carbides and bainitic matrix in c
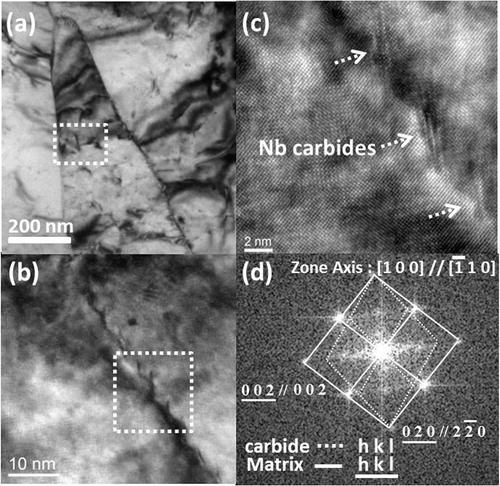
Table 4. Dislocation density of granular bainite after tempering at 600°C for different time intervals
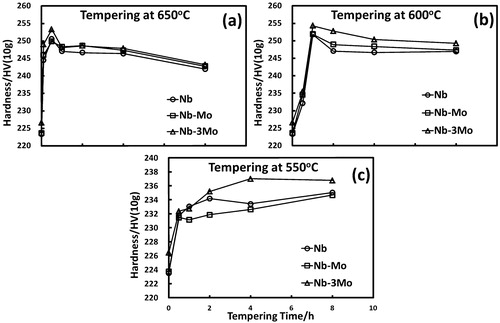
7. Hardness of granular bainite versus tempering time at a 650°C, b 600°C and c 550°C
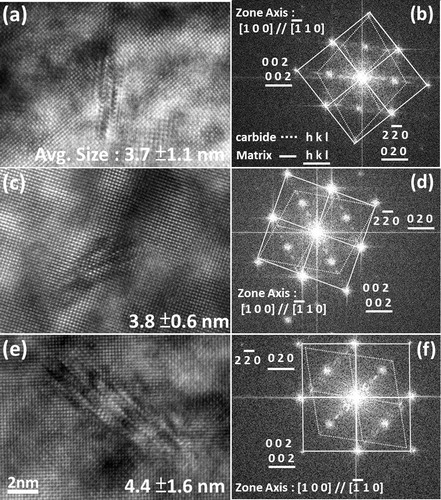
8. Images (HR-TEM) illustrating Moiré fringes of nanometre sized carbides at bainitic matrix in a strip Nb, c strip Nb–Mo and e strip Nb–3Mo and b, d, f corresponding FFT images for strips tempered at 600°C for 1 h
9. Energy dispersive X-ray spectrum of (NbxMo1−x) carbides precipitated at bainitic matrix, being individually examined at a strip Nb–Mo and b strip Nb–3Mo after tempering at 600°C for 1 h
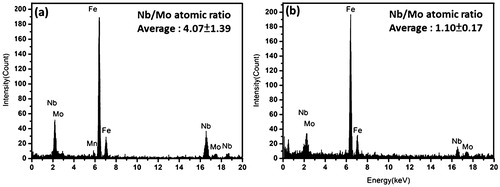
Table 5. Yield/tensile strength (MPa) of as rolled strips after tempering at 600°C for different time intervals
Table 6. Elongation (%) of as rolled strips after tempering at 600°C for different time intervals