Figures & data
Figure 1. BSEI micrographs (a 50 μm, b 10 μm) of Al0.5CrFeCoNiCu in the as cast state showing a dendritic microstructure
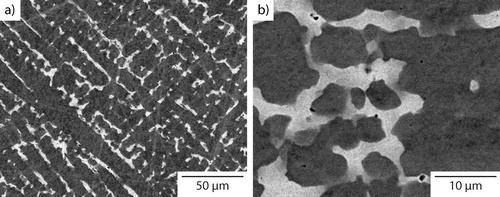
Figure 2. DSC thermogram from as cast Al0.5CrFeCoNiCu during heating (red) and cooling (blue) at 10°C min−1
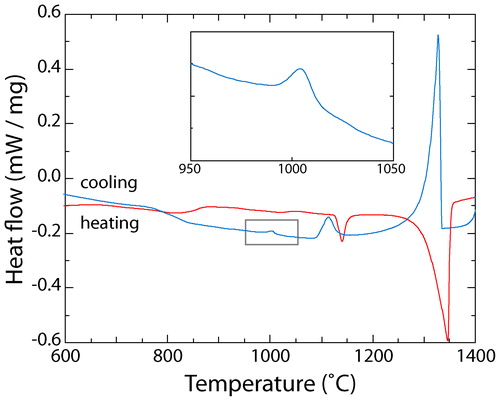
Figure 3. BSEI micrographs (a 50 μm; b 10 μm) of Al0.5CrFeCoNiCu cooled at 10°C min−1 from the liquid state
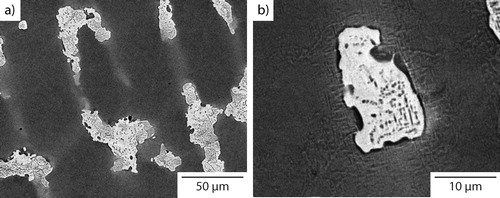
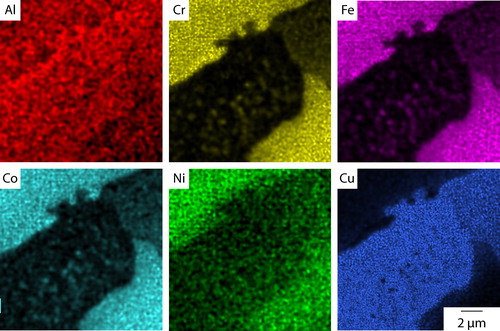
Figure 4. EDX elemental distribution maps from Al0.5CrFeCoNiCu cooled at 10°C min−1 showing Cr, Fe and Co rich precipitates within the interdendritic constituent
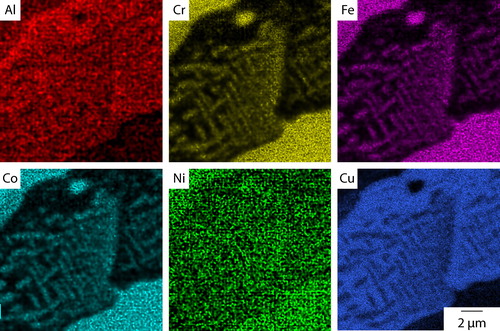
Figure 5. a BSEI of the microstructure of Al0.5CrFeCoNiCu cooled at 10°C min−1 showing precipitation in both the dendritic and interdendritic constituents and b corresponding Cu EDX map indicating that the fine acicular precipitates within the dendrites are Cu rich
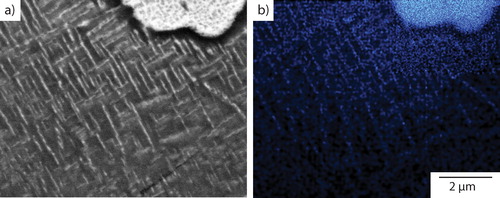
Figure 6. DSC thermograms illustrating the influence of cooling rate on Al0.5CrFeCoNiCu
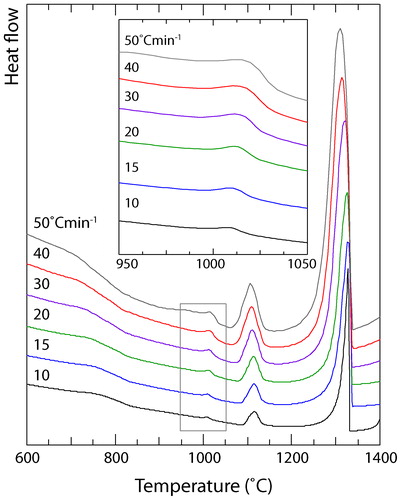
Figure 7. BSEI micrographs (a 50 μm, b 10 μm) of Al0.5CrFeCoNiCu cooled at 50°C min−1 from the liquid state
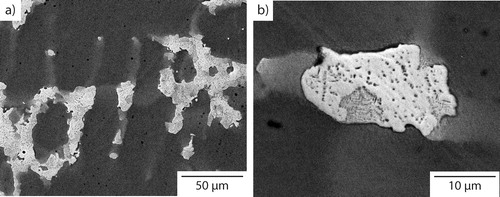
Figure 8. EDX elemental distribution maps from material cooled at 50°C min−1 showing Cr, Fe and Co rich precipitates within the interdendritic constituent