Figures & data
Table 1. Ambient tensile property data for FC-0205 steels
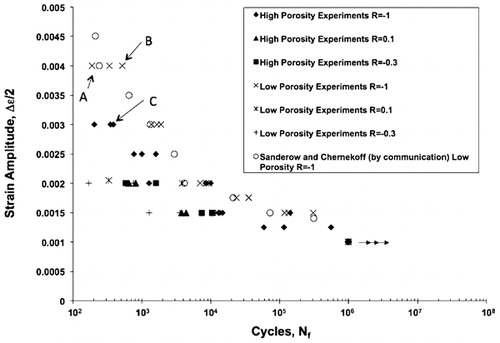
1. FC-0205 steel alloy strain–life curve for different porosity levels and R ratios; A–C correspond to fractography analysis presented in , and respectively
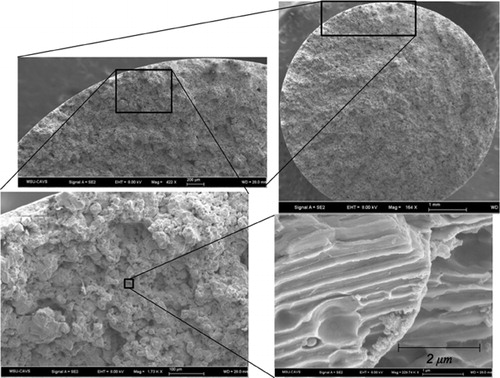
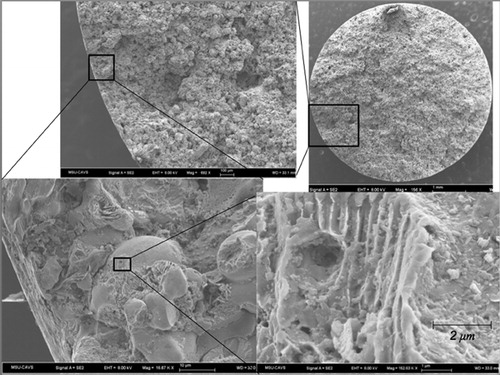
2. Fracture surfaces of fatigue specimen A
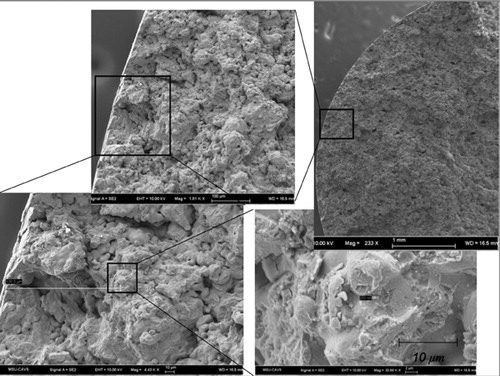
3. Fracture surfaces of fatigue specimen B
4. Fracture surfaces of fatigue specimen C
5. Monotonic tension specimen reported by Allison et al.Citation36 with microstructural features similar to uniaxial fatigue specimens
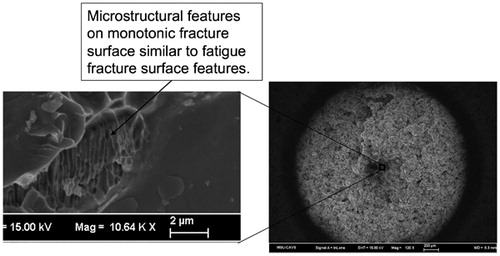
Table 2. Macrovoid fatigue fracture surface characteristics
Table 3. Microvoid fatigue fracture surface characteristics
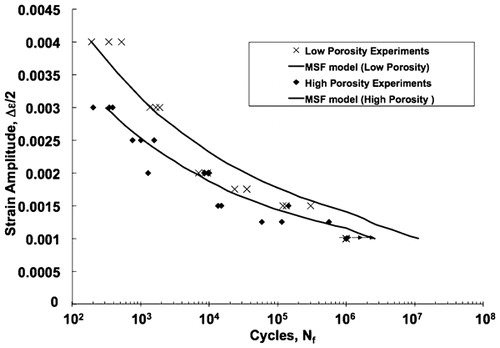
6. Strain amplitude versus cycles to failure data and best fit relationships from results of fatigue tests on low and high porosity test specimens