Figures & data
Figure 1. Structure of saponarin.
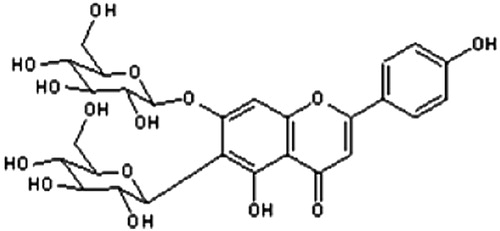
Figure 2. TBARS and GSH levels on rat liver in saponarin group (receiving saponarin 80 mg/kg p.o. 3 days), cocaine group (40 mg/kg, single i.p. injection on third day) and saponarin + cocaine group (80 mg/kg p.o. 3 days + 40 mg/kg, single i.p. injection 2 hours after the last saponarin administration). Data are expressed as mean ± SEM of six rats. *P < 0.05 versus control group; +P < 0.05 versus cocaine-treated group.
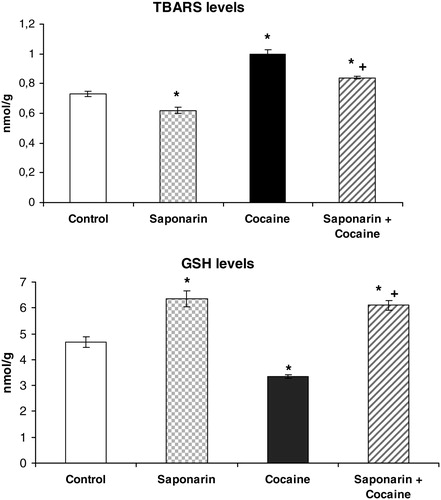
Figure 3. CAT, SOD, and GPx activities on rat liver in saponarin group (receiving saponarin 80 mg/kg p.o. 3 days), cocaine group (40 mg/kg, single i.p. injection on third day) and saponarin + cocaine group (80 mg/kg p.o. 3 days + 40 mg/kg, single i.p. injection 2 hours after the last saponarin administration). Data are expressed as mean ± SEM of six rats. *P < 0.05 versus control group; +P < 0.05 versus cocaine-treated group.
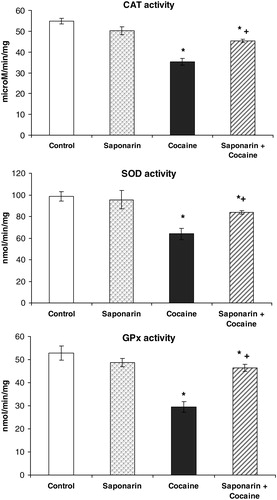
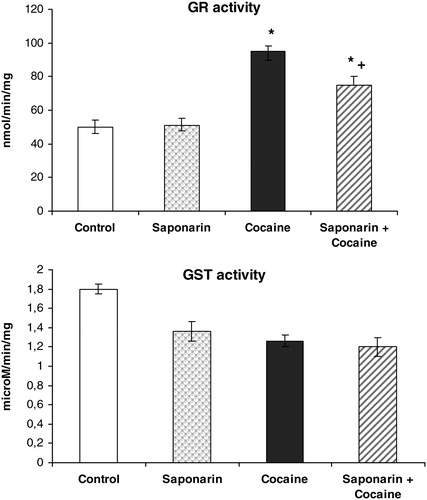
Figure 4. GR and GST activities on rat liver in saponarin group (receiving saponarin 80 mg/kg, p.o. 3 days), cocaine group (40 mg/kg, single i.p. injection on third day) and saponarin + cocaine group (80 mg/kg p.o. 3 days + 40 mg/kg, single i.p. injection 2 hours after the last saponarin administration). Data are expressed as mean ± SEM of six rats. *P < 0.05 versus control group; +P < 0.05 versus cocaine-treated group.