Figures & data
Figure 1. Time course of lipid peroxidation caused by inoculation with B. japonicum on soybean roots. Data are mean ± SD, n = 4. P < 0.01 as assessed by Tukey's t-test. NI, not inoculated; I, inoculated plants.
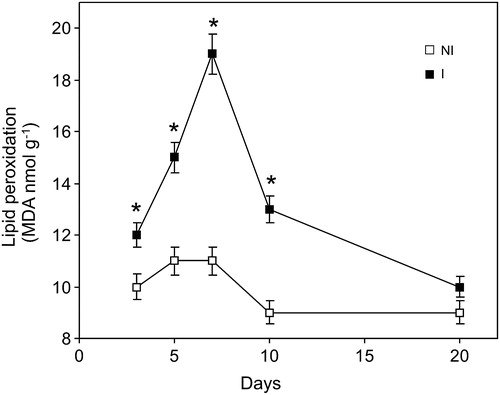
Figure 2. Time course changes of GSH levels caused by inoculation with Bradyrhizobium japonica on soybean roots. Data are mean ± SD, n = 4. P < 0.01 as assessed by Tukey's t-test. NI, not inoculated; I, inoculated plants.
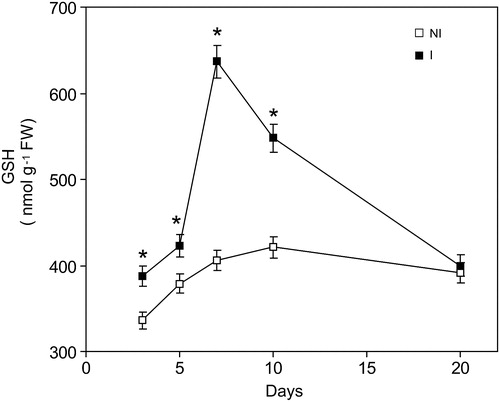
Figure 3. Histochemical detection of lipid peroxidation and the loss membrane integrity caused by inoculation. The roots were stained with Schiff's reagent (A), Evans blue (B), Nitroblue tetrazolium (C) and DAB (D) in soybean root as described in Materials and methods. NI, not inoculated; I, inoculated plants.
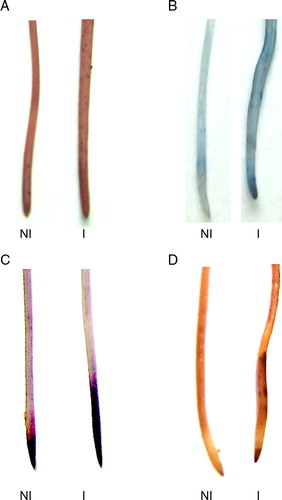
Figure 4. Classical antioxidant enzymes SOD and CAT gene expression at seventh day post-inoculation with B. japonicum on soybeans roots. CAT and SOD mRNA expressions were analyzed by semiquantitative RT-PCR as described in Materials and methods. The 18S amplification band is shown to confirm equal loading of RNA and RT efficiency. Values are the mean of four independent experiments and bars indicate SD. *Significant differences (P < 0.01) with respect to not inoculated plants, according to Tukey's multiple range test. NI, not inoculated; I, inoculated plants.
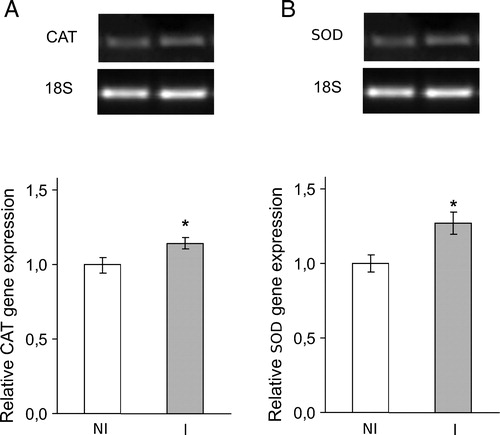
Figure 5. Time course of HO-1 gene expression caused by inoculation with B. japonicum on soybeans roots. HO-1 mRNA expression was analyzed by semiquantitative RT-PCR as described in Materials and methods. The 18S amplification band is shown to confirm equal loading of RNA and RT efficiency. Values are the mean of four independent experiments and bars indicate SD, with respect to control according to Tukey's multiple range test.
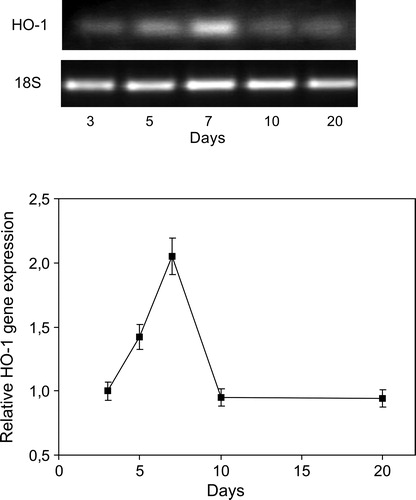
Figure 6. HO-1 gene expression in soybean roots exposed to H2O2 (2.4 mM), paraquat (Par) (5 µM) or ZnPPIX (20 µM) during 24 hours. HO-1 mRNA expression was analyzed by semiquantitative RT-PCR as described in Materials and methods. The 18S amplification band is shown to confirm equal loading of RNA and RT efficiency. Values are the mean of four independent experiments and bars indicate SD. *Significant differences (P < 0.01) with respect to not inoculated control according to Tukey's multiple range test. NI, not inoculated; I, inoculated plants.
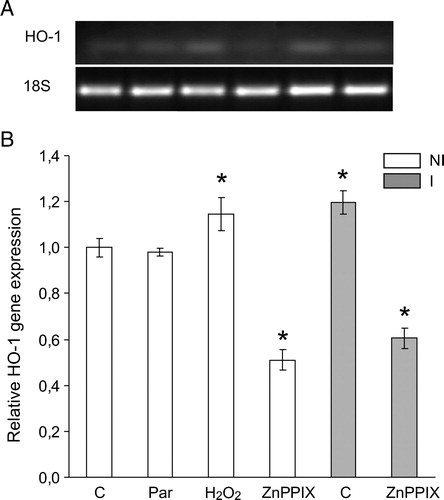
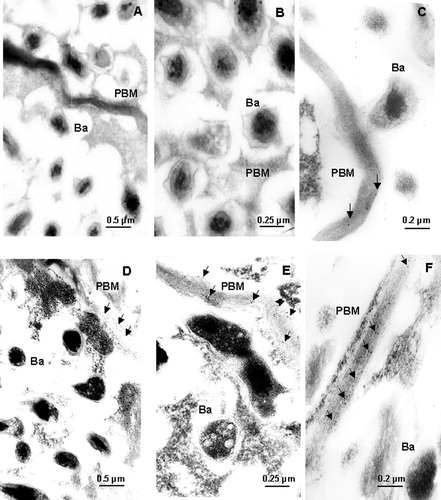
Figure 7. Immunogold localization of HO-1 in mature nodules. Controls (A, B, and C) and salt-treated (D, E, and F) nodules were incubated and labeled as described in Materials and methods. Ba, bacteroid; PBM, peribacteroid membrane. Arrows indicate HO spots. Magnification: 20 000× (A and D), 40 000× (B and E), 50 000× (C and F).