Figures & data
Table 1. Mouse gene-specific PCR primers
Figure 1. Photomicrographs of HE (A, B), Peal's (C, D), and TUNEL staining (E) after continuous injection of Fe-NTA for 2 weeks. Note that robust inflammation was induced in and around the hippocampus. An apoptotic change was induced in the hippocampus, but not in the vicinity. (Original magnification ×40.)
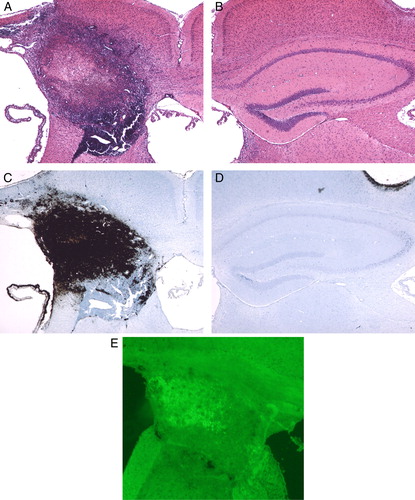
Figure 2. Photomicrographs of HE (A, B, C), Peal's (D, E, F), and TUNEL staining (G, H) after continuous injection of Fe-NTA for 4 weeks. The hippocampus was totally destroyed and replaced by inflammatory cells (A, B). High-level iron accumulated at a marginal area of the hippocampal space, and lower level iron was observed on the choroid plexus and ependymal cells of the third ventricle (D, E). Localization of TUNEL-positive cells corresponded to that of a higher level of iron in the hippocampal space (G, H). (Original magnification ×40 for B, C, E, F, H, and ×100 for A, D, G.)
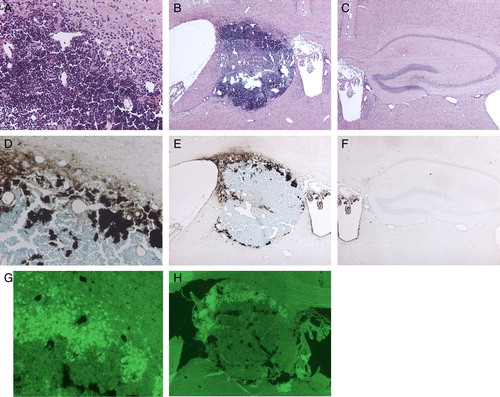
Figure 3. Dot blot analysis of the hippocampus after continuous injection of Fe-NTA for 2 weeks. The levels of 4-HNE were normalized with beta-actin. Fe-NTA raised the levels of 4-HNE significantly (n = 4, *P < 0.05).
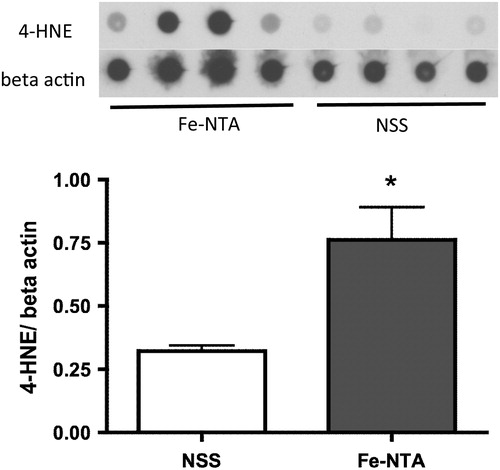
Figure 4. Photomicrographs of HE (A, B) and TUNEL staining (C, D) after continuous injection of H2O2 for 2 weeks. (D) is a high magnification picture of white rectangular area of Fig. (C). H2O2 induced apoptotic changes in cells in the striatum as well as the hippocampus, while the damage in the hippocampus was much less than that after Fe-NTA injection. (Original magnification; ×40 for A, B, C, and ×100 for D.)
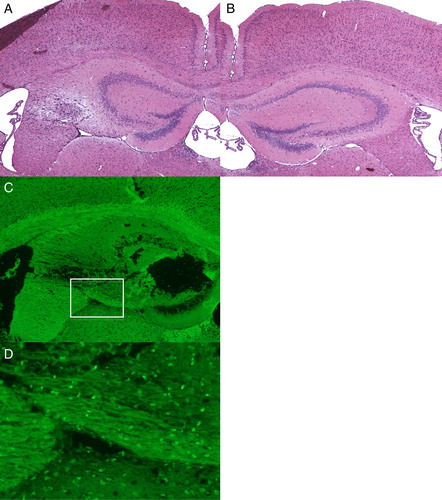
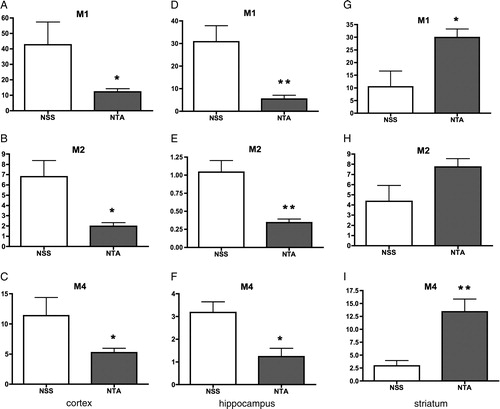
Figure 5. Changes in levels of M1, M2, and M4 mAChRs in the cortex, hippocampus, and striatum. In both the cortex and hippocampus, levels of all three kinds of mAChRs were decreased after the Fe-NTA injection significantly (A–F). Especially, M1 mAChR was deteriorated with the Fe-NTA, of which the average level was 17.7% of NSS group (D). On the contrary, each average of three kinds of mAChRs increased in the striatum (G–I), and there were significant differences in M1 and M4 (G, I).