Figures & data
Table 1. Demographic data of the two groups of cancer patients
Table 2. Intraoperative values of clinical and physical status of the two groups of patients
Figure 1. Effects of FiO2 on arterial blood gas analysis (PaO2 and PaCO2) in the two groups (0.30 FiO2 and 0.80 FiO2) of cancer patients, before surgery and after surgery. Values expressed as scatter plot and median (horizontal bars). Differences were analysed with two-tailed tests for non-parametric data: Mann–Whitney U and Wilcoxon tests. P values <0.05 were considered statistically significant. (A and C), PaO2 values in the 0.80 FiO2 group were significantly higher (P < 0.001) than in the 0.30 FiO2 group's values, before and after surgery. (B and D), in PaCO2 values, no differences were found between the study groups, before and after surgery.
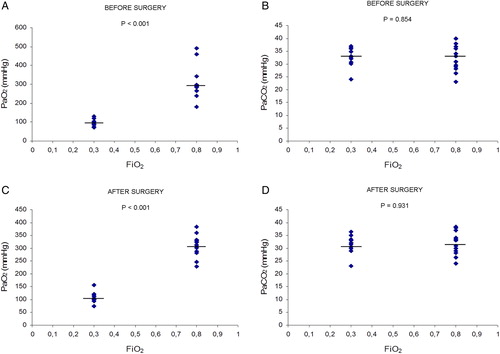
Table 3. Effects of FiO2 on arterial blood gas analysis in the two groups of cancer patients
Figure 2. Effects of FiO2 on levels of oxidative stress markers like MDA and GSSG in arterial blood of the two groups (0.30 FiO2 and 0.80 FiO2) of cancer patients, before surgery and after surgery. Values expressed as scatter plot and median (horizontal bars). Differences were analysed with two-tailed tests for non-parametric data: Mann–Whitney U and Wilcoxon tests. P values <0.05 were considered statistically significant. (A and B), MDA and GSSG values respectively – for these markers no differences were found between the study groups before surgery. (C and D), MDA and GSSG, respectively, in the 0.30 FiO2 group were significantly higher than in the 0.80 FiO2 group after surgery.
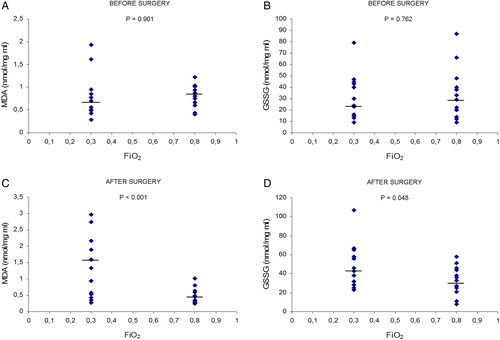
Figure 3. Effects of FiO2 on MDA levels, XO activity, XDH activity, XO + XDH activities, and XO/(XO + XDH) ratio in colonic mucosa from excised colon in the two groups of cancer patients. MDA, malondialdehyde; XO, xanthine oxidase; XDH, xanthine dehydrogenase. Values expressed as scatter plot and median (horizontal bars). Differences were analysed with two-tailed tests for non-parametric data: Mann–Whitney U and Wilcoxon tests. P values <0.05 were considered statistically significant. (A) MDA values were significantly lower in the 0.80 group than in the 0.30 group. (B) XO activity was significantly lower in the 0.80 group than in 0.30 group. (C) On XDH activity no differences were found between the study groups. (D) On XO + XDH activities no differences were found between the study groups. (E) On XO/(XO + XDH) ratio, values were significantly lower in 0.80 group than 0.30 group.
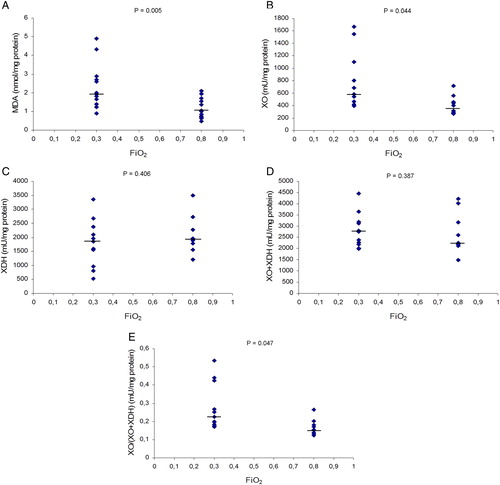
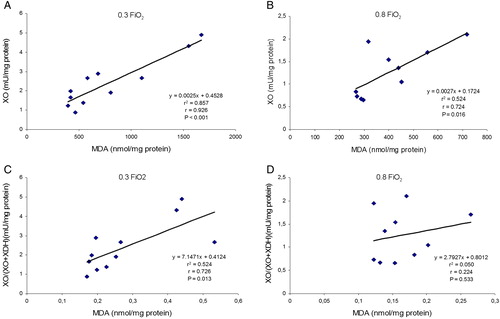
Figure 4. Effects of FiO2 on the correlations between MDA levels and XO activity and XO/(XO + XDH) ratio in colonic mucosa from removed piece of colon in the two groups of patients. MDA, malondialdehyde; XO, xanthine oxidase; XDH, xanthine dehydrogenase. r, Pearson's correlation coefficient. XO enzymatic activity and XO/(XO + XDH) ratio as independent variables and MDA as a dependent variable. P values <0.05 were considered statistically significant. (A) correlation between MDA levels and XO activity was very significant in 0.30 FiO2 group. (B) correlation between MDA levels and XO activity was significant in 0.80 FiO2 group and the r value was lower than 0.30 FiO2 group. (C) correlation between MDA levels and XO/(XO + XDH) ratio on 0.30 FiO2 group was statistically significant. (D) correlation between MDA levels and XO/(XO + XDH) ratio in 0.80 FiO2 group was not statistically significant and the r value was lower than 0.30 FiO2 group.