Figures & data
Figure 1. (A) Structures of PYO and MB in oxidized and reduced forms. (B) PYO and MB as redox cycling catalysts in vivo: NAD(P)H-dependent reduction of the blue oxidized forms and rapid re-oxidation of the leuco forms by auto-oxidation. (C) PYO and MB as diaphorase substrates of P. falciparum mitochondrial lipoamide dehydrogenase. In the Lineweaver–Burk diagram, the ordinate axis intercepts represent the reciprocal values of the specific activity for PYO (squares) and MB (circles). The enzyme preparation described in the experimental section was used. The OH group of PYOox has a pKa of 4.9.
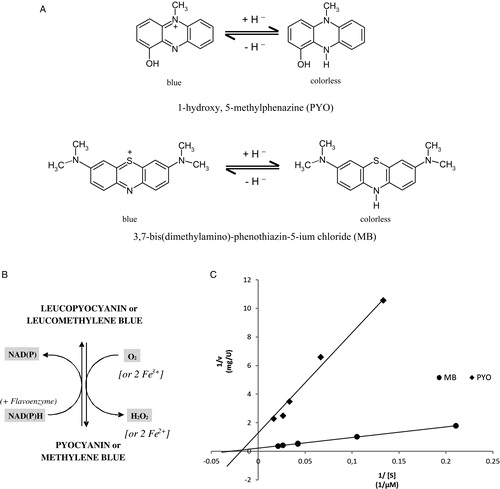
Figure 2. Spectra of PYO in oxidized and NADPH-reduced form in 50 mM potassium phosphate buffer of pH 7. The peak at 340 nm in the reduced spectrum (dotted line) is largely due to excess NADPH.
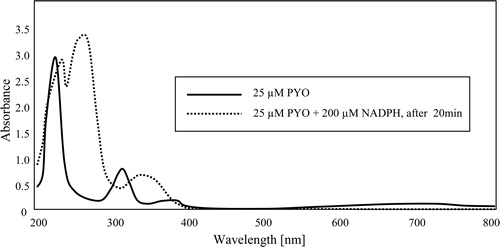
Table 1. Properties of PYO in comparison to MB
Table 2. Enzyme-kinetic data for interactions of PYO and MB with disulfide reductases
Figure 3. Human GR homodimer with bound PYO. PYO (blue) and FAD (yellow) are represented as ball-and-stick models. Additionally, the surfaces of the catalytic cysteines Cys58/Cys63 and Cys58′/Cys63′ (yellow) and of PYO (blue) are shown. The atomic coordinates and their structure factors determined by x-ray diffraction analysis have been deposited at the PDB (Protein Data Bank) under the accession code (PBD ID) 3SQP. Molecular graphics images were produced using the UCSF Chimera package.Citation26
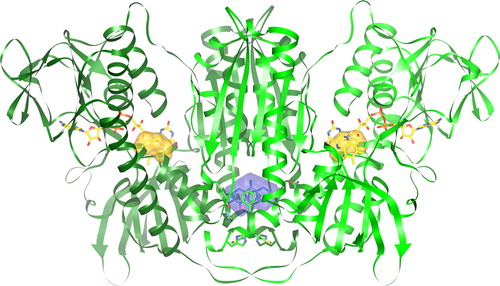
Figure 4. Binding of PYO to human GR. For clarity only one of the two observed orientations of PYO (blue carbon atoms) is shown. Green Cα-atoms indicate amino acids at distances of less than 5 Å from the ligand. O atoms are shown in red, N atoms in blue, and sulfur atoms in yellow.
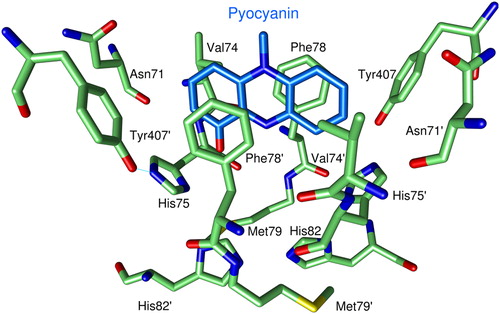
Table 3. Summary of data collection and structure refinement of the crystalline GR–PYO complex
Figure 5. Stage-specific effects of various concentrations of PYO (x-axis, given in nM) on different developmental stages of the asexual forms of P. falciparum in cultured erythrocytes. The data indicate a rapid antiparasitic effect, with the schizont stage exhibiting the highest susceptibility.
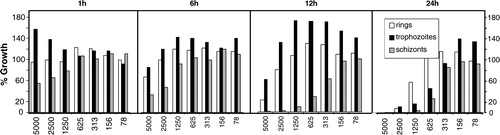
Table 4. In vitro activities of PYO, MB, and CQ against immature (day 9) and mature (day 13) P. falciparum gametocytes