
Figures & data
1. Conventional approaches and their alternatives
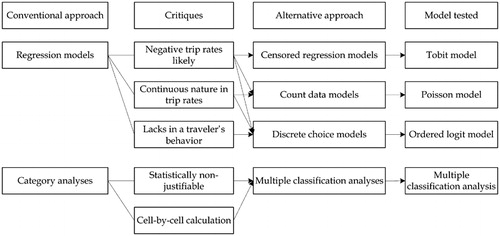
Table 2. Number of households by trip rate
Table 1. Advantages and limitations of the cross-validation methods
Table 5. Estimation results for regression, tobit, Poisson, and ordered logit models
Table 3. Independent variables considered
Table 4. The specification for regression, tobit, Poisson, and ordered logit models
Table 6. Marginal effects of ordered logit model
Table 7. Average daily commuting trips per household by cross-classification
Table 8. The result of one-way ANOVAs for the multiple classification analysis
Table 9. Average daily commuting trips per household by multiple classification
Table 10. The result of validation