Figures & data
Figure 1. Illustrative representation of observed mean CD4+ cell count trajectories for two sets of individuals similar to those in the MOTIVATE placebo arm: one set with data at week 48 and one whose CD4+ cell count was last measured at week 12. Imputed means for the latter group are also shown, under each of the models used in the analysis.
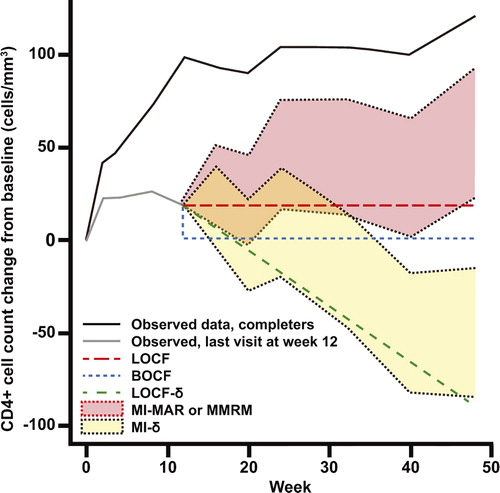
Table 1. Reasons for discontinuations and duration of exposure in the week 48 analyses of the SINGLE and MOTIVATE studies
Figure 2. CD4+ cell count data for MOTIVATE (A) adjusted CD4+ cell count mean (standard error–SE) change from baseline (CFB) at week 48 on each arm (cells/mm3) (B) estimated difference (SE) between each maraviroc arm and placebo (PBO). For the analyses at a single timepoint, covariates included in the models were treatment (MVC QD, MVC BID, and PBO), protocol (1, 2), enfuvirtide use in optimized background therapy at baseline (yes, no), baseline absolute CD4+ cell count (continuous), baseline log10 HIV-1 RNA (continuous), baseline age (continuous), gender (female, male) and overall susceptibility score of regimen (0, 1, 2, ≥ 3, missing) at baseline. For the longitudinal models, time (categorical, 10 visits) was added along with two-way interaction between time and each of the covariates and a common unstructured covariance structure was used. The bars show 95% confidence intervals.
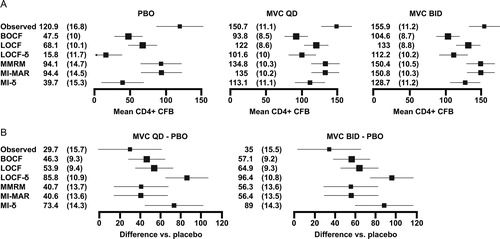
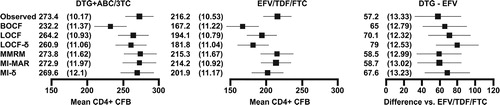
Figure 3. CD4+ cell count data for SINGLE: adjusted CD4+ cell count mean change (SE) from baseline at week 48 on each arm (cells/mm3) and the estimated treatment difference (SE) between DTG+ABC/3TC and EFV/TDF/FTC. For the analyses at a single timepoint, covariates included in the models were treatment (DTG+ABC/3TC, EFV/TDF/FTC), race (white, non-white), baseline HIV-1 RNA ( ≤ 100 000, >100 000 copies/ml), baseline CD4+ cell count ( ≤ 200, >200 cells/mm3) and baseline age ( < 36, ≥ 36 years). For the longitudinal models, time (categorical, eight visits) was added along with two-way interaction between time and each of the covariates and a common unstructured covariance structure was used. The bars show 95% confidence intervals.