Figures & data
Table 1. Determination of serum protein binding of AFN-1252
Figure 1. Rate of kill of AFN-1252 against MRSA 1659 in the presence and absence of 75% mouse and human serum.
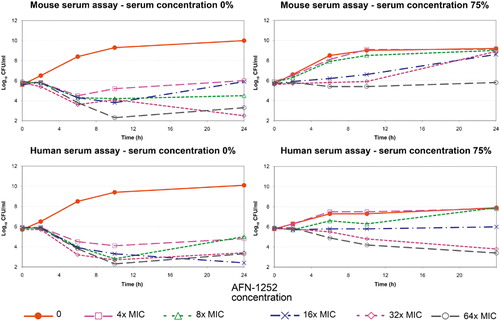
Figure 2. Inhibitory effect models: change in log CFU/ml vs AFN-1252 concentrations at the 10-hour time point. (A) Human serum; (B) Mouse serum.
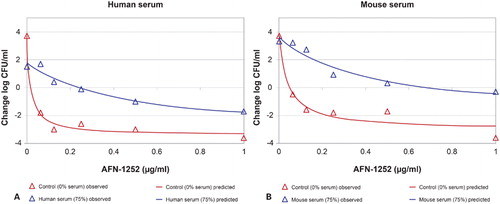
Table 2. In vitro activity of AFN-1252 and comparators against S. aureus in the presence and absence of pulmonary surfactant
Table 3. Average PAE from four experiments
Table 4. Checkerboard analysis of AFN-1252 with S. aureus
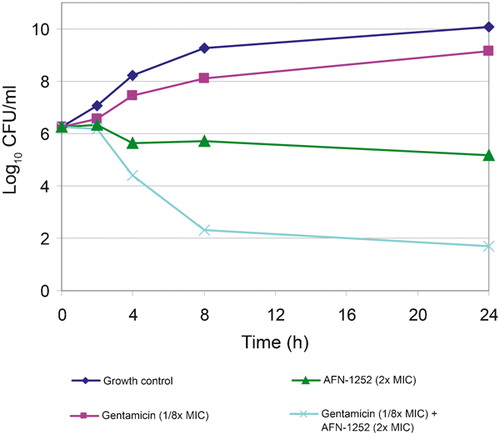
Figure 3. Time-kill graphs to show synergy of AFN-1252 with gentamicin against MSSA 29213.