Figures & data
Table 1. Demographic and Injury Characteristics of Calibration Sample and PHQ Crosswalk Subsample
Table 2. SCI-QOL Depression Descriptive Item Statistics (Calibration Sample, n = 716)
Table 3. SCI-QOL Depression Items and IRT Parameters (Calibration Sample, N = 716)
Table 4. Linking Table: SCI-QOL Depression and PHQ-9
Table 5. T-score lookup table for SCI-QOL Depression Short Form 10a
Figure 1. SCI-QOL Depression Item Bank Information and Precision.
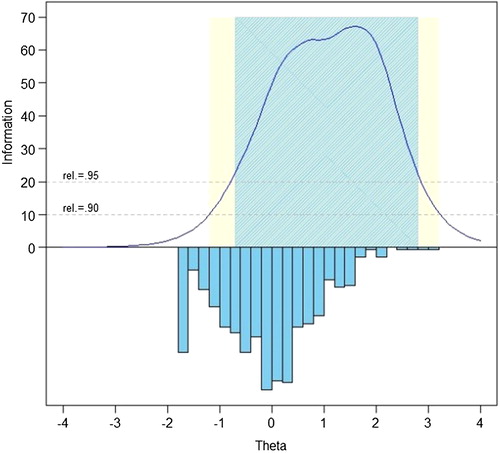
Figure 2. SCI-QOL Depression: Reliability by T-score and Assessment Method.
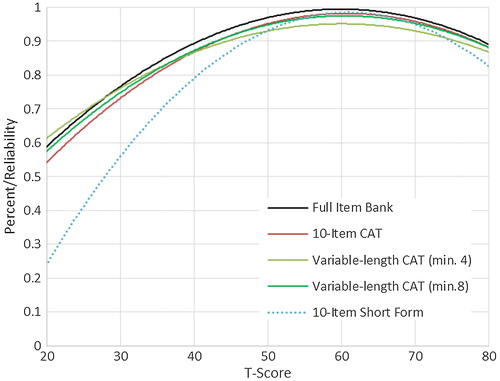
Table 6. Breadth of Coverage for SCI-QOL Depression, PHQ-9, and PHQ-2 (Calibration and PHQ Crosswalk Samples)
Figure 3. Relationship Between SCI-QOL Depression T-scores and PHQ-9 Raw Scores.
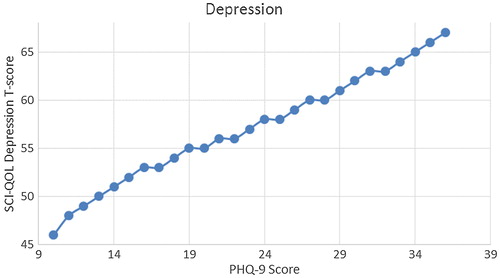
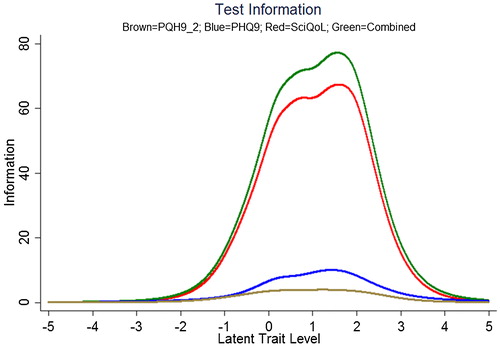
Figure 4. Marginal Reliability of PHQ-2, PHQ-9, SCI-QOL Depression, and Combined (n = 465). Colors relate to the online version of the figure.
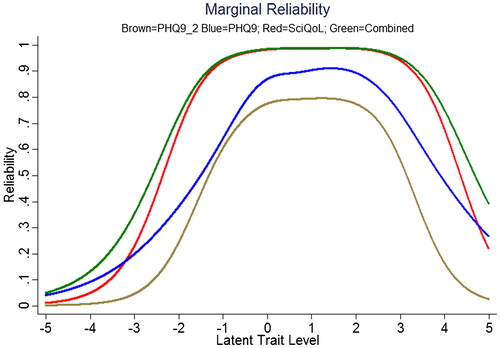
Figure 5. Scale information provided by the PHQ-2, PHQ-9, SCI-QOL Depression, and Combined. Note: Scale information is shown on the y-axis and T-scores are shown on the X-axis. The scale (or test) information curve (or function) indicates the level of information (i.e. reliability) provided by the scale over the range of the construct continuum. Colors relate to the online version of the figure.