
Figures & data
Table 1. Calibration sample – participant characteristics
Table 2. Descriptive item statistics
Figure 1. SCI-QOL positive affect & well-being item bank information and precision.
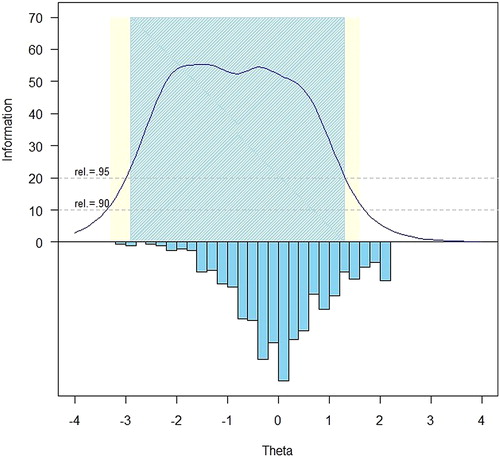
Table 3. Positive affect and well-being items and item bank parameters
Figure 2. SCI-QOL PAWB: Measurement Reliability by T-score and assessment method.
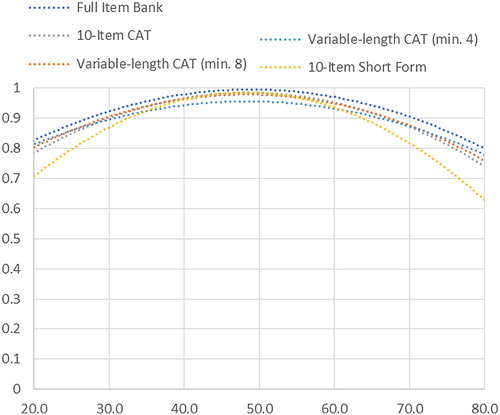
Table 4. Accuracy of variable- and fixed-length CAT and 10-item short form: correlations with full-bank score
Table 5. Breadth of coverage for variable length CAT, fixed length CAT, 10-item short form, and full item bank
Table 6. Raw score to T-score conversion table for PAWB SF10a