
Figures & data
Table 1. Demographic and Injury Characteristics of Calibration Sample and GAD Crosswalk Subsample
Figure 1. SCI-QOL Anxiety Item Bank Test Information and Precision.
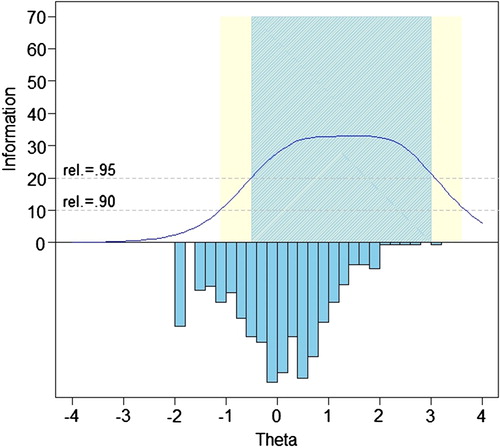
Table 2. SCI-QOL Anxiety Descriptive Item Statistics
Table 3. SCI-QOL Anxiety Item Response Theory Parameters
Figure 2. SCI-QOL Anxiety: Measurement Reliability by T-score and Assessment Method.
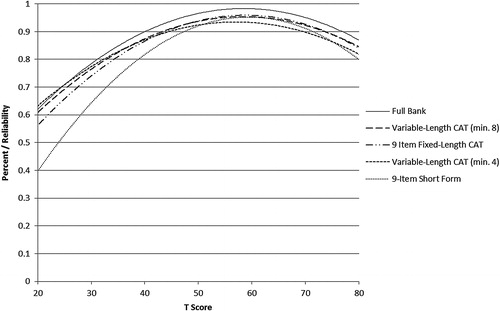
Table 4. T-score lookup table for SCI-QOL Anxiety Short Form 9a
Table 5. Breadth of Coverage for SCI-QOL Anxiety and GAD-7
Figure 3. Relationship between SCI-QOL Anxiety and GAD-7 scores. *Individuals reporting no anxiety symptoms (i.e. “never” to all items), and an extremely high amount have been omitted from this graph due to instability of score estimates.
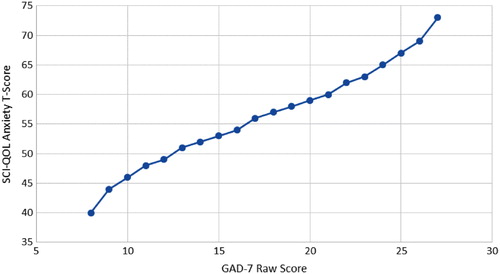
Figure 4. Marginal Reliability of GAD-7, SCI-QOL Anxiety, and Combined (n = 465). Colors relate to the online version of the figure.
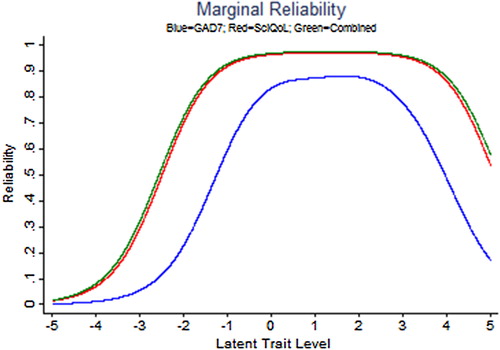
Figure 5. Scale information provided by the GAD-7, SCI-QOL Anxiety, and Combined. Colors relate to the online version of the figure.
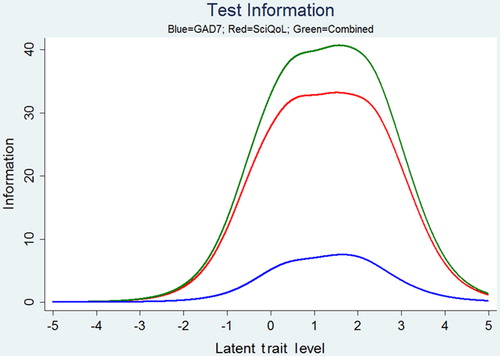
Table 6. Linking Table: SCI-QOL Anxiety and GAD-7