Figures & data
Figure 1. The relationships between the plasma albumin concentration in children with severe malnutrition and (a) the percentage chance of them having signs of oedema, and (b) their mortality risk, as identified by WhiteheadCitation5 and HayCitation7 in the early 1970s.
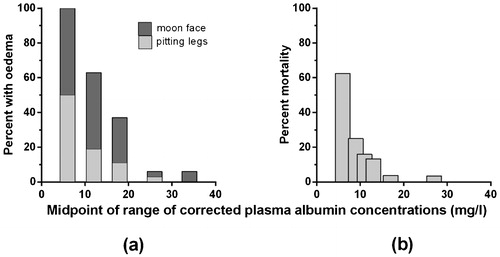
Figure 2. Graphs of the changes in plasma albumin concentrations in children on dietary treatment for kwashiorkor before, during and after the disappearance of oedema, from Golden et al, 1980.Citation9 In graphs b to d, the filled circles represent paired pre- and post-treatment levels, and the open circles are cases where the correct patient pairing is not known.
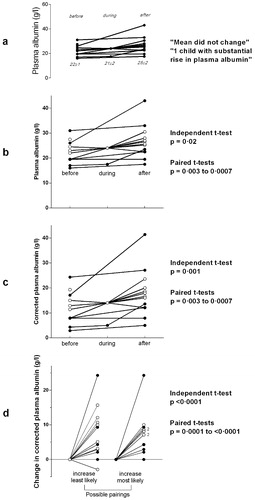
Figure 3. The corrected albumin concentrations measured in children with kwashiorkor (a) compared to children with marasmus in 12 studies, and (b) before and after feeding in 10 studies, four of which tested two different milks. Golden’s study detailed in is shown by filled circles and a broken line in graph (b), and the other lines are identified by the text references.
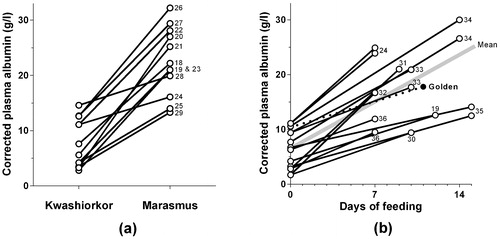
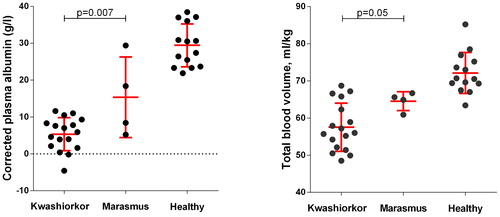
Figure 4. Corrected albumin concentrations and total blood volume measurements in children with kwashiorkor, marasmus, and healthy controls, from Viart.Citation43 The malnourished children selected for this comparison were aged <3 years, with kwashiorkor defined as having ≧2+ oedema, and marasmus as having 0 or ± oedema. The error bars show the mean and standard deviation values.