Figures & data
Figure 1. The reflectance imaging spectroscopy workflow. A multispectral reflectance image cube is constructed and analyzed to determine a basis set of reflectance spectra (‘endmembers’) that best describe the miniature from 400 to 950 nm. The endmembers are used to make spatial maps to guide site selection for FORS and XRF analysis. (A) Workshop of Pacino di Buonaguida, ‘Christ in majesty with twelve apostles’, c. 1320, Rosenwald collection (photo by Ken Fleisher; image courtesy of the National Gallery of Art, Washington, DC); (B) 3D representation of the image cube; (C) a projection of clusters into two of the 12 dimensions defined by the MNF transform; (D) spectral endmembers obtained by the hyperspectral processing; (E) spatial map of endmembers obtained using the SAM algorithm using angle tolerances in Table 1.
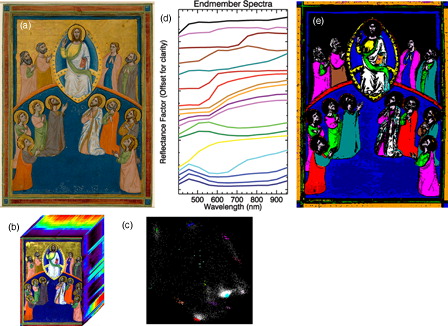
Table 1. Summary of analytical results regarding pigment identification. Angle tolerance values refer to the spectral maps in –4. In the XRF column, pigments listed in boldface are those most likely responsible for the visible appearance (color) of the analyzed areas. Key: Major, Minor, (trace). In the ‘possible assignment’ column: (from underlying layer).
Figure 2. Maps and spectra of the blue and green endmembers. (A) Endmember map representing the (B) blue and green endmember spectra; (C) associated FORS spectra from sites defined by the maps; (D) XRF spectra from sites in the green, blue, and purple map regions. The results indicate that blue fields (1, 2) are painted with azurite except in the area around Christ (3), which has ultramarine layered on top of the azurite. Ultramarine is also used for the blue highlights on Christ (4). The green areas (5, 6) all have the same reflectance spectral shape, corresponding to a Cu-based green likely mixed with a yellow pigment, which can probably be identified as lead-tin yellow based on the XRF spectra.
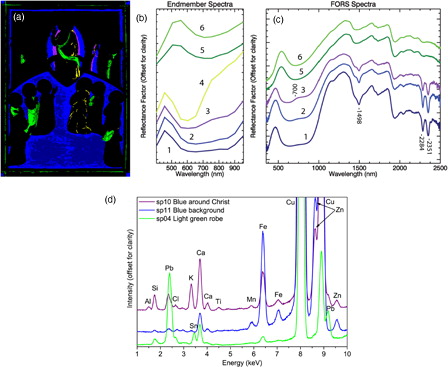
Figure 3. Maps and spectra of the brown, white, flesh tone, yellow, red, and black endmembers. (A) Endmember map representing the (B) endmember spectra; (C) associated FORS spectra from sites defined by the maps. The maps and site analysis find the brown cloak (7) is painted with an iron oxide pigment, the white robes (8) are lead white, yellow areas (10) are similar spectrally and are lead-tin yellow, the red robes (11a, 11b) are red lead but shading with a dark pigment underneath is also found in the robe of the lower left apostle. A black outline on the halos (12) shows a spectrum indicative of an iron-based ink.
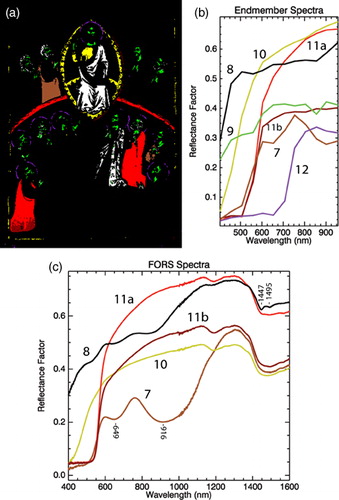
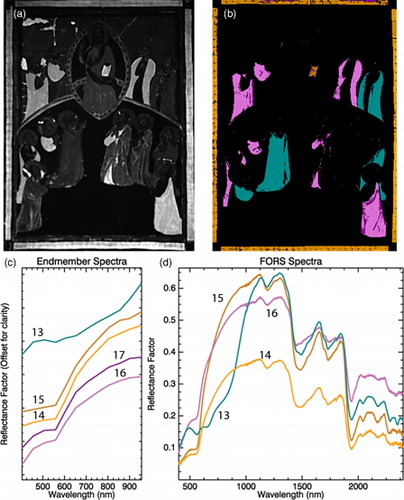
Figure 4. The luminescence image, maps, and spectra of the purple and luminescent pink and red endmembers. (A) Luminescence image at 700 nm; (B) endmember map representing the (C) endmember spectra; (D) associated FORS spectra from sites defined by the maps. The purple cloaks (13) are spectrally similar and are obtained with azurite mixed with a red organic dye. The red book and border (14, 15) are both painted with a red organic dye with varying amounts of dye and similarly the pink robes are also painted with a red dye mixed with varying amounts of lead white.