
Figures & data
Figure 1. Celluloid hair comb, c.1910. Image credit: Colin Williamson
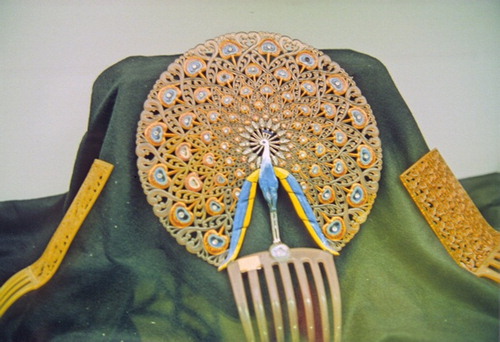
Table 1. Analytical techniques covered within this review
Figure 2. The figure illustrates how material degradation, macroscopic damage, and VOC emissions are inter-related. VOC analysis can therefore provide information about both material degradation and object damage.
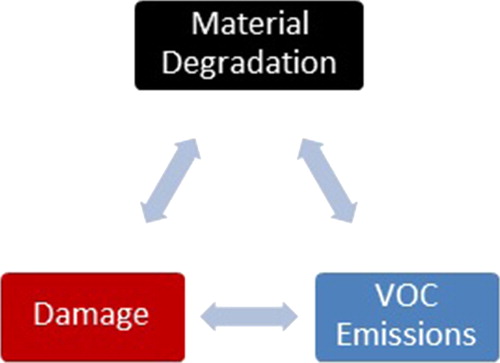
Table 2. Summarized results of reviewed research showing relationships between perceived damage to objects, VOC emissions, and polymer degradation
Figure 3. Construction in Space: Two Cones, condition in 2001. The Work of Naum Gabo ©Nina and Graham Williams. Reproduced with permission. Photograph: Joe Mikuliak
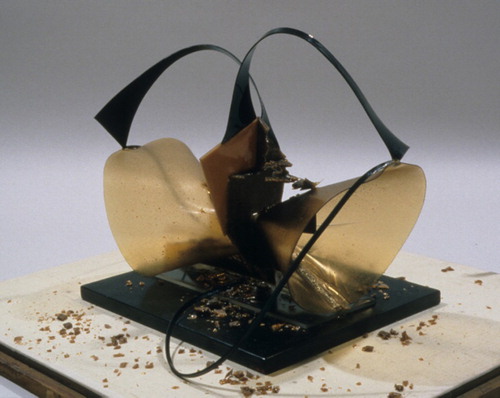
Figure 4. SPME-GC-MS chromatogram of U-matic tape sample showing the presence of, e.g. heptanoic acid (6) and octanoic acid (7). Reprinted from Thiebaut et al. (Citation2007) with permission from Elsevier.
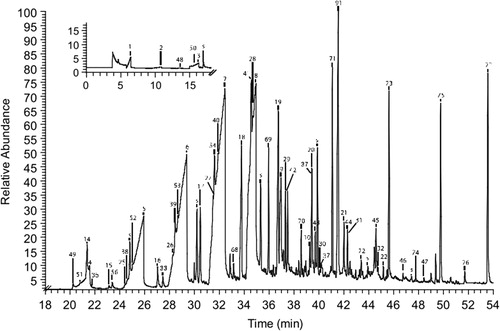
Figure 5. Chromatogram showing results of Py-GC-MS analysis of artificially degraded polyester-based PUR foams showing increase in toluene diamine isomers (TDA) and adipic acid (AA) with increased degradation time. Reprinted from Lattuati-Derrieux et al. (Citation2011) with permission from Elsevier.
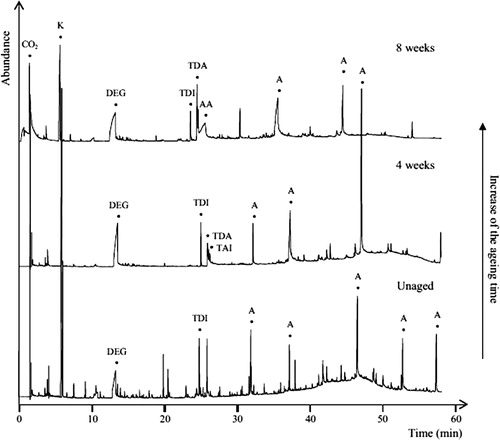
Table 3. Summarized results of reviewed research showing how detection of VOC emissions can be used to provide evidence of degradation, and to monitor degradation progress
Figure 6. Relative abundance of detected low-molecular weight compounds from samples of HIPS following different periods of thermo-oxidative degradation. Reprinted from Vilaplana et al. (Citation2010) with permission from Elsevier.
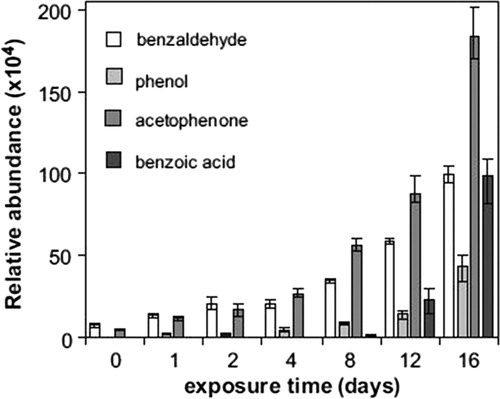
Table 4. Summarized results of reviewed research showing identified VOC emissions for different materials