Figures & data
Figure 1. Map of India with study site indicated.
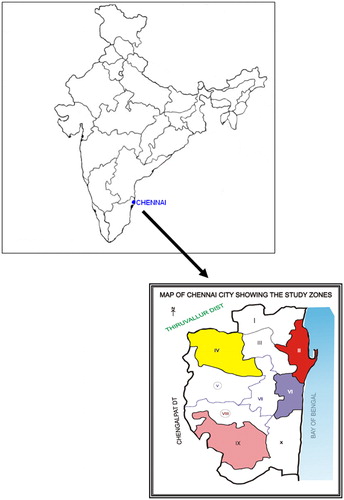
Figure 2. Wooden cover to prevent Aedes breeding in cement tanks.
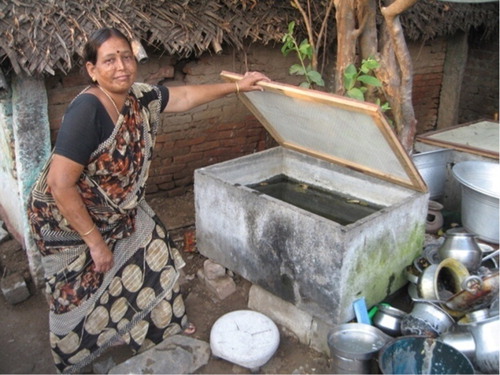
Table 1. Knowledge about dengue and dengue prevention in the study population before and after the intervention, Chennai
Table 2. Major container types and numbers with pupae found during the wet season base line survey (November–December 2009) in Chennai
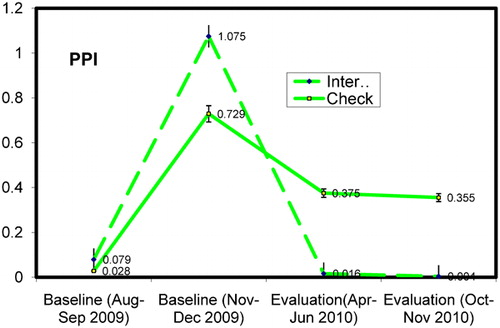
Figure 3. Pupae per person index (95% confidence interval) in intervention and check clusters (August 2009 to November 2010) Chennai, India.