Figures & data
Figure 1. Graph illustrating the percentage of citations in books for Plasmodium falciparum and Plasmodium vivax from 1900 to 2008 by use of the tool at http://books.google.com/ngrams (1A, top), and citation data from PubMed since 1960 (1B, bottom) taken from CitationRef. 86 published under Creative Commons license. These graphs reproduced from CitationRef. 28 with the permission of Clinical Microbiology Reviews.
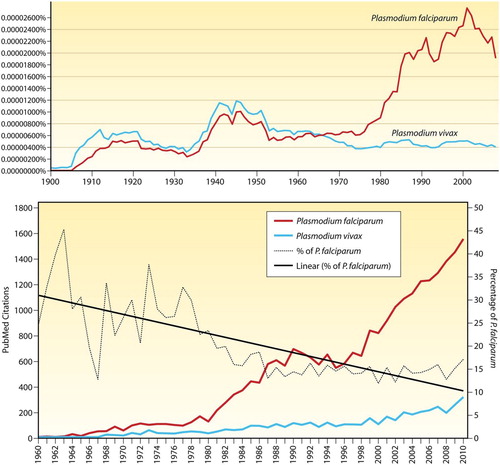
Figure 2. Chemical structures of the synthetic antimalarials created by I.G. Farben/Bayer in Germany during the 1920s and 1930s (pamaquine, mepacrine and chloroquine) and primaquine from the US Army during the 1940s. Reproduced from CitationRef. 6 with the permission of Clinical Microbiology Reviews.
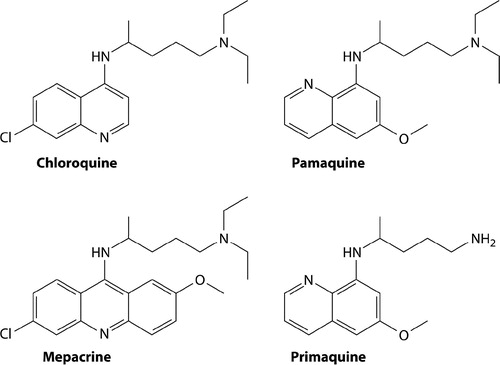
Figure 3. Map illustrates the diversity of common variants of G6PD deficiency in eastern Asia and dominance of Mediterranean variant in western Asia. Reproduced from CitationRef. 60 published under Creative Commons license.
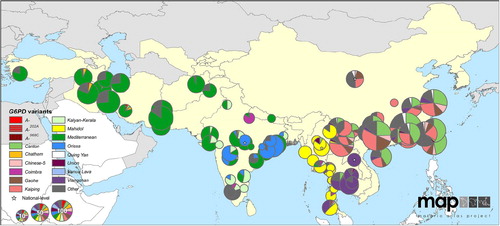
Figure 4. Maps illustrate geographic distribution of crude estimates of risk related to primaquine dosing derived by considering severity of impaired G6PD activity phenotype. Reproduced from CitationRef. 14 published under Creative Commons license.
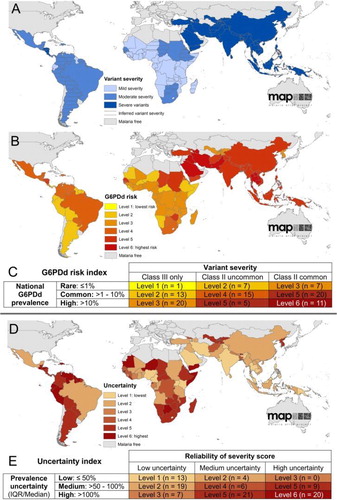
Figure 5. Data illustrating key variance in the extent to which G6PD activity may be impaired among variants. The x-axis, ‘Position in the Gradient (C.D.F.)’ represents fractions of red blood cells collected by ultracentrifugation, where the youngest cells are to the left, and oldest cells to the right. The top three panels illustrate the proportion of red blood cells as reticulocytes among G6PD-normal (panel A) and two subjects having either A − (panel B) or Mediterranean (panel C) variants of G6PD deficiency. Panels G, H and I, illustrate relative activities of G6PD enzyme in the same age-dependent gradient. Note the conspicuous distinction between A − and Mediterranean variants, where in the latter even reticulocytes suffer severely impaired enzyme activity. In contrast, the youngest A − red cells have nearly normal activity. This difference largely explains the ability of A − patients to develop tolerance to large doses of primaquine as in Fig. 6, whereas Mediterranean patients do not. Reproduced from CitationRef. 64 with the permission of the Journal of Clinical Investigation.
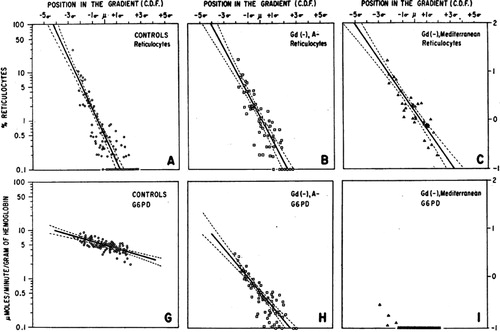
Figure 6. Graph illustrates development of tolerance to primaquine in three otherwise healthy African–American subjects with A − variant of G6PD deficiency. After an initial haemolytic anaemia, reticulocytemia followed and in turn haematocrit returned to normal. The subjects then maintained effective normal blood profiles despite receiving daily doses of 30 mg primaquine for 120 days. Reproduced from CitationRef. 65 with permission of the Bulletin of the World Health Organization.
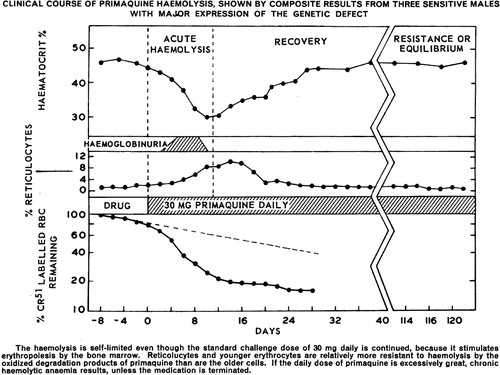
Figure 7. Primaquine treatment policies against relapse among endemic nations in 2014. Reproduced with permission of the World Health Organization, Global Malaria Program, Geneva.
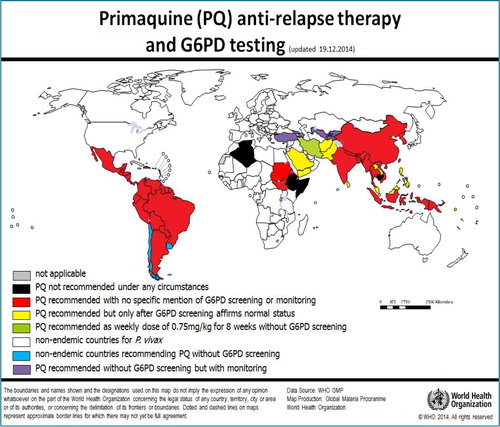
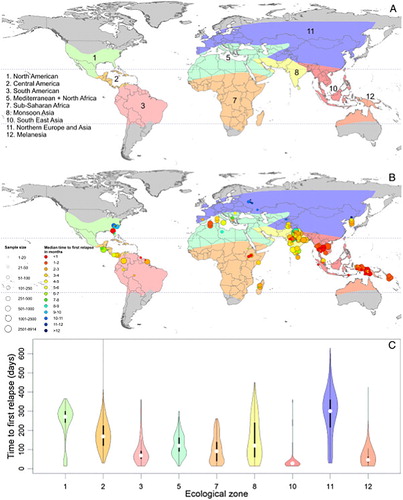
Figure 8. Map charts geographic variation in relapse behaviours by Plasmodium vivax among ecological zones and the graph below illustrates the timing and frequency of relapse within each ecological zone. Reproduced from CitationRef. 70 published under Creative Commons license.