Figures & data
Figure 1. Example of the chemiluminescence (CL) process
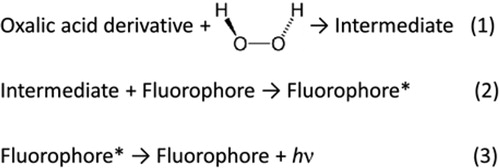
Figure 2. Schematic of the chemiluminescence (CL) reaction in the porous one-dimensional (1D) photonic crystal. The CL reagents are infiltrated at the same time in the porous structure. The CL spectrum will be modulated by the photonic structure
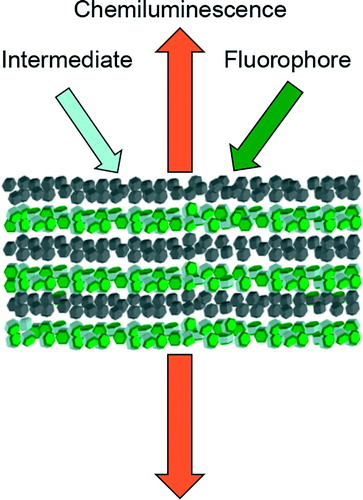
Figure 3. Transmission spectrum of the porous one-dimensional (1D) photonic crystal (PhC) before and after infiltration of the chemiluminescence (CL) reagents. Authors observe a shift of 40–45 nm with infiltration, owing to the change of the effective refractive index of the photonic crystal layers
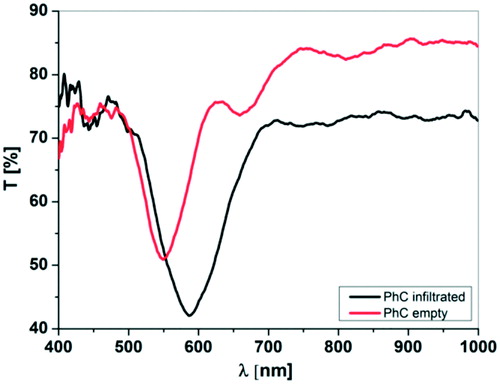
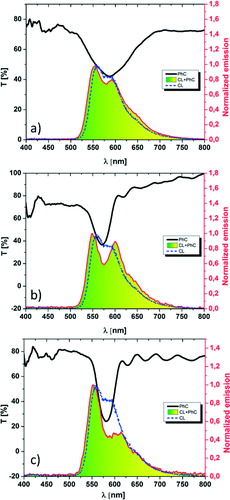
Figure 4. Chemiluminescence (CL) emission with rubrene filtrated by the one-dimensional porous photonic crystal made by (a) spin coating technique and (b) and (c) by pulsed laser deposition with two different porosities of the layers. The black curves show the transmission spectra of the photonic crystals. The blue dashed curves depict the CL spectrum of rubrene, while the red curves represent the CL spectra of rubrene with the CL reagents infiltrated in the porous photonic crystals