Figures & data
Table 1. Composition and codification of main PLA samples selected for this study
Figure 1. a–c TEM images to illustrate morphology at nano-scale of designated fillers: 1D = OMLS (C25A), 2D = HNT, 3D = SiO2 (scale bar is of 100 nm)
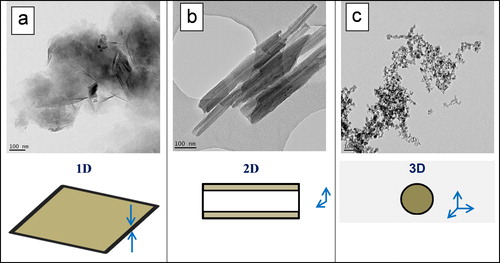
Figure 2. a–c scanning electron micrographs (SEM) to illustrate initial aggregate structure of as received fillers: 1D = OMLS, 2D = HNT, 3D = SiO2 (NB: for better evidencing of NPs different morphology, dissimilar magnifications were used)
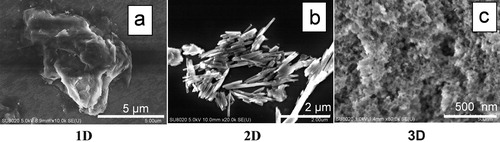
Figure 3. a–d illustration of ‘hydrophobicity’ in the presence of water of HNT and SiO2 treated with b, d EBS with respect to a, c respectively untreated nanofillers
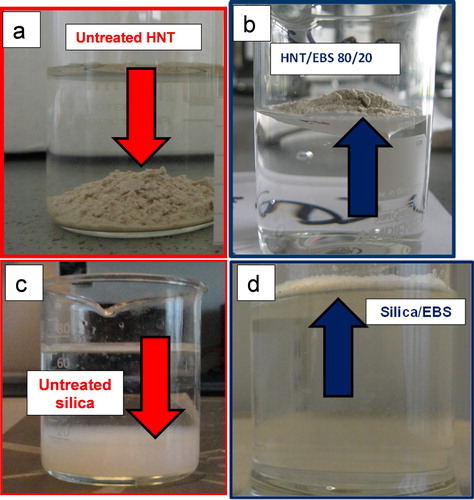
Figure 4. a, b TEM images of a untreated HNT and b HNT/EBS
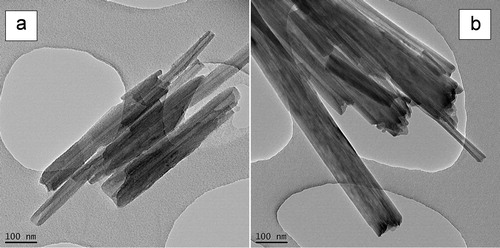
Figure 5. a, b comparative DSC traces of PLA (with and without EBS) and those of PLA nanocomposites containing nanofillers (with/without EBS) as they were recorded a during cooling and b during second heating (rate of 10°C min− 1 was used in both DSC scans)
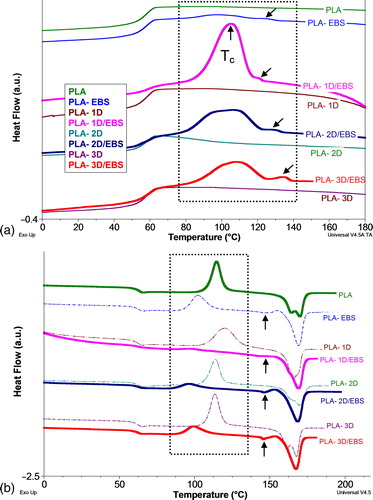
Table 2. Comparative DSC data of PLA and PLA nanocomposites containing nanofillers with/without EBS (second DSC heating, 10°C min− 1)
Table 3. Half-time of crystallization of neat PLA and PLA nanocomposites containing nanofillers with/without EBS
Table 4. Comparative DSC data on specimens performed by injection molding of PLA and PLA nanocomposites containing nanofillers with/without EBS (first DSC heating, 10°C min− 1)
Figure 6. Comparative WAXS patterns on specimens performed by injection molding of PLA and PLA nanocomposites containing nanofillers with/without EBS
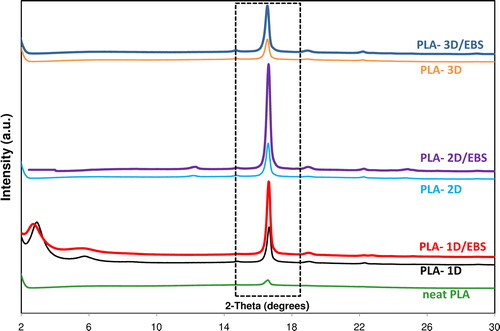
Figure 7. a–f selected TEM images at low and high magnification of nanocomposites loaded with 3% NPs (coated by EBS): a, d PLA-1D/EBS; b, e PLA-2D/EBS; c, f PLA-3D/EBS
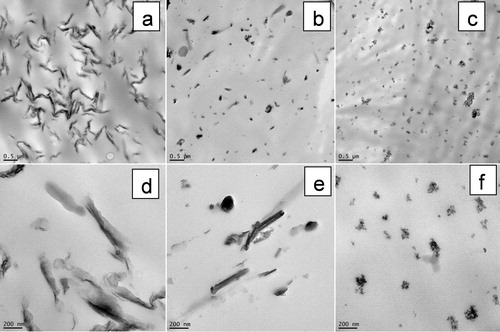
Table 5. Comparative mechanical properties of PLA and PLA nanocomposites (with/without EBS)
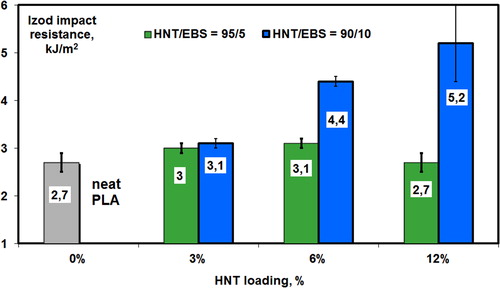
Figure 8. Effects of HNT/EBS ratio and nanofiller loading on impact resistance (Izod) of PLA–(3–12)%HNT/EBS nanocomposites: HNT/EBS ratio of 95/5 and 90/10