Figures & data
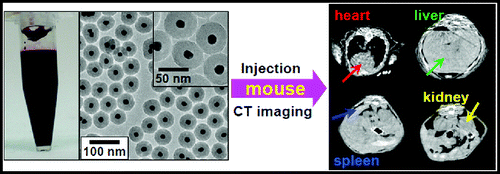
Figure 1. Photographs of Au/SiO2-NH2 particle colloid solutions that were prepared with APES concentrations of a 5 × 10− 5, b 1 × 10− 4, c 1.5 × 10− 4, d 2 × 10− 4 and e 2.5 × 10− 4M
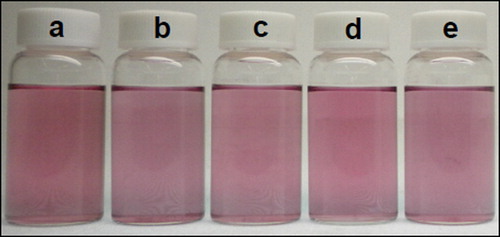
Figure 2. UV-VIS extinction spectra of Au/SiO2-NH2 particle colloid solutions, which were prepared with various APES concentrations. The black, red, blue, green and pink spectra correspond to samples a–e in Fig. 1, respectively
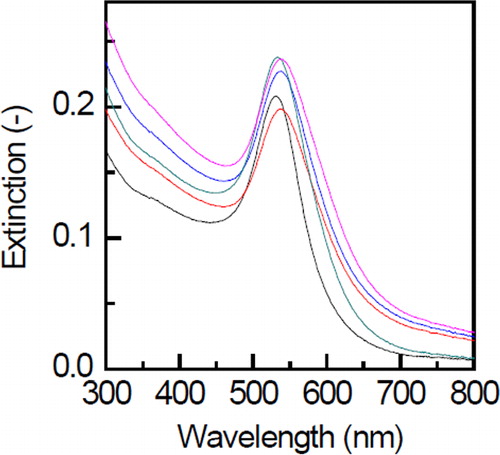
Figure 3. Transmittance electron microscopy (TEM) images of Au/SiO2-NH2 particles. Insets are high magnification images. The samples were prepared at various APES concentrations, which were identical to those in Fig. 1
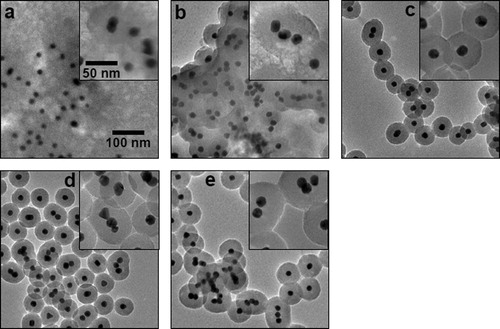
Figure 4. Zeta-potentials of Au/SiO2-NH2 particles as a function of the pH. The black, red, blue, green and pink plots correspond to samples a–e in Fig. 1, respectively
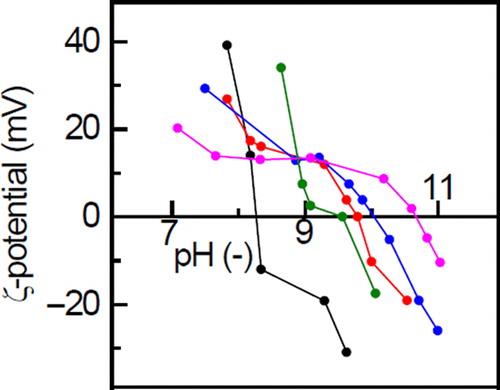
Figure 5. Images of Au/SiO2/PEG particles. Images a–c are photographs of their colloid solution, transmittance electron microscopy (TEM) image, and a CT image of their colloid solution, respectively
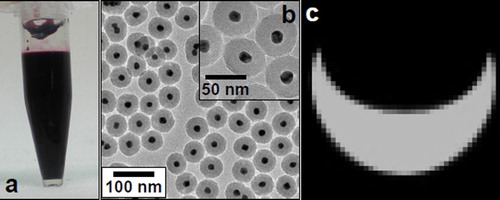
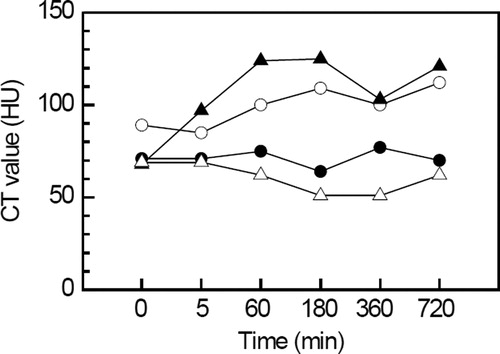
Figure 6. CT images of the heart (red arrows), liver (green arrows), spleen (blue arrows) and kidney (yellow arrows) of the mouse after injecting the Au/SiO2/PEG particle colloid solution. The images were taken a before injection and at b 5, c 60, d 180, e 360, and f 720 min after injection
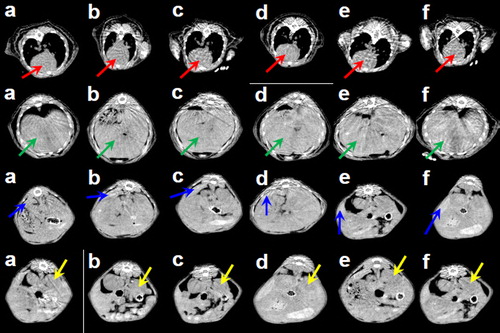
Figure 7. CT values of the heart (closed circles), liver (open circles), spleen (closed triangles) and kidney (open triangles) of a mouse after the injection of a concentrated Au/SiO2/PEG particle colloid solution