Figures & data
Figure 1. a UV-visible spectra of polycarbonate (PC)–zinc oxide (ZnO) nanocomposite film with varied ZnO loading and b UV-visible and photoluminescence (PL) (λ(ex) @350 nm) spectra of 1 wt-% ZnO–PC film
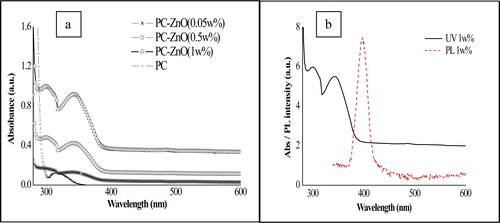
Figure 2. XRD spectra of as-synthesized zinc oxide (ZnO) nanoparticles and its comparison with ZnO– polycarbonate (PC) nanocomposite film and PC film
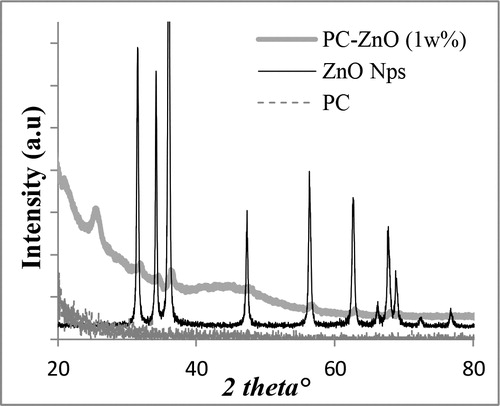
Figure 3. TGA profile of polycarbonate (PC) and PC–zinc oxide (ZnO) nanocomposite film; P4 with 1 wt-% and P2 with 0.2 wt-% of ZnO nanoparticles
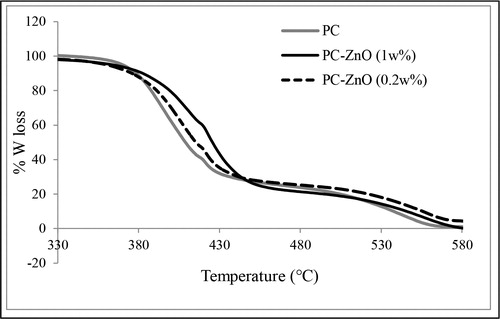
Table 1. Polycarbonate (PC)–zinc oxide (ZnO) nanocomposite films showing antibacterial effect for gram-positive (S. aureus) and gram-negative (E. coli) bacteria
Figure 4. a Antibacterial activity of zinc oxide (ZnO) nanoparticles against S. aureus and E. coli and b related graphical comparison of turbidity as measure of cell viability, c photograph of a typical ZnO–polycarbonate (PC) film
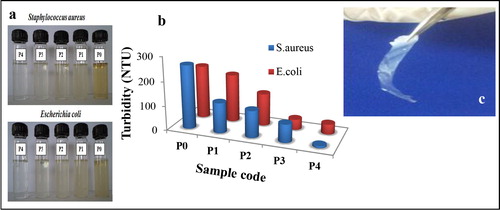
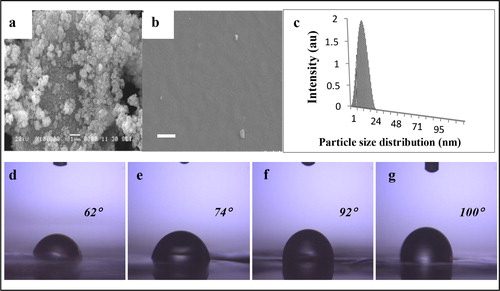
Figure 5. Representative antimicrobial mechanisms of zinc oxide (ZnO) nanoparticles
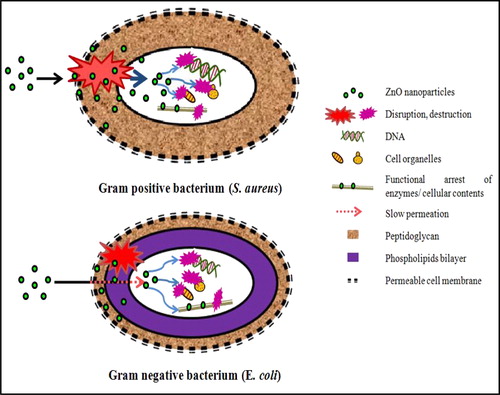
Figure 6. SEM of a as-synthesized zinc oxide (ZnO) nanoparticles, b polycarbonate (PC)–ZnO film with 1 wt-% of ZnO, (scale bar is 1 μm in both the images) and c particle size distribution profile of as-synthesized ZnO nanoparticles measured by DLS technique. Below, contact angle measurement images of PC and PC–ZnO films d PC film, e 0.2 wt-% ZnO, f 0.5 wt-% ZnO and g 1 wt-% ZnO