Figures & data
Figure 1. Differences in analgesic consumption across Europe. Source: IMS, year 2008. Figure shows PTD per capita for selected European countries. Basis for calculation: sum of sold units of selected analgesics converted into PTDs based on average daily consumption. For anticonvulsants and antidepressants, only their use for pain treatment is considered.
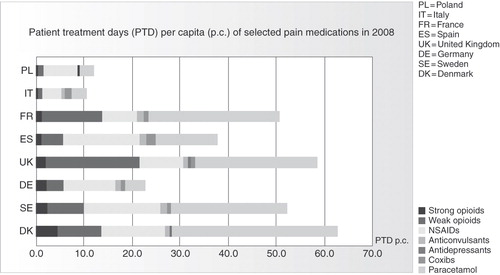
Figure 2. Differences in opioid consumption across Europe. Source: IMS, year 2008. Figure shows PTD per capita for selected European countries. Basis for calculation: sum of sold units of selected analgesics converted into PTDs based on average daily consumption.
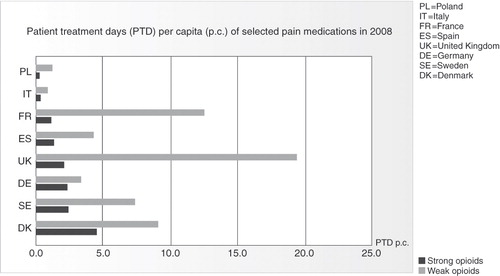
Figure 3. Physicians’ perceptions of treatment success (ITT = Individual Treatment Target).
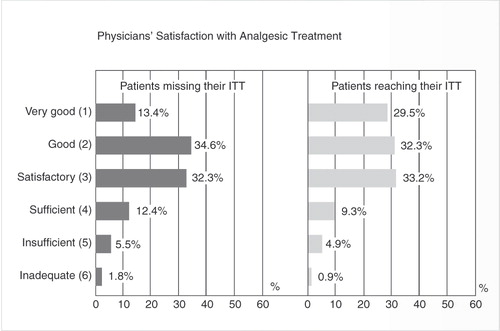
Figure 4. The Vicious Circle showing interaction of influencing factors.
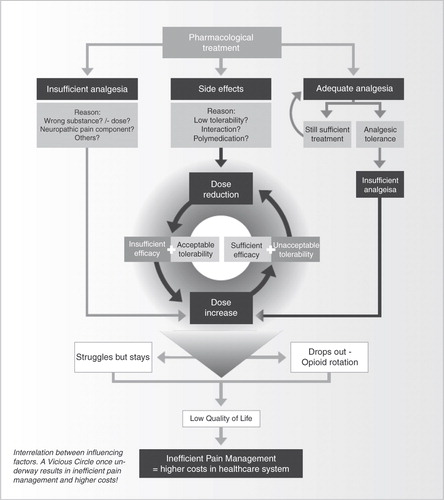
Figure 5. Opioid treatment discontinuation rates.
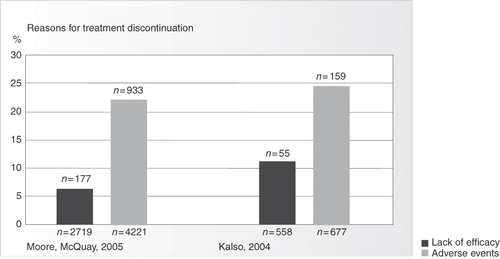
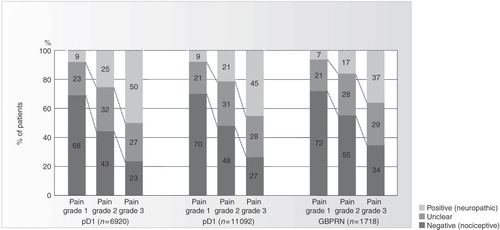
Figure 6. Composition and severity of back pain.