
Figures & data
Figure 1. Mean BS-11 pain score by visit: full analysis population.
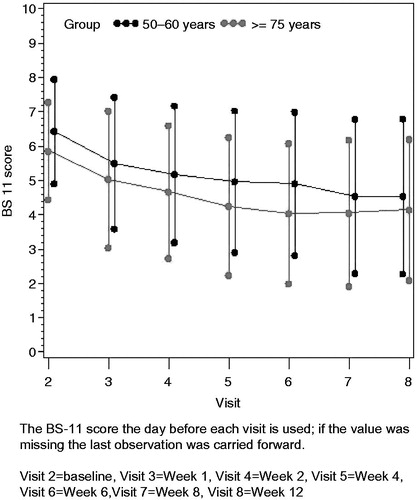
Table 1. BS-11 pain scores at baseline and last visit, and change from baseline to the last visit: full analysis population.
Table 2. Results of ANCOVA model for change from baseline to the last visit in BS-11 pain score: full analysis population.
Figure 2. Boxplot of WOMAC total score by visit: full analysis population.
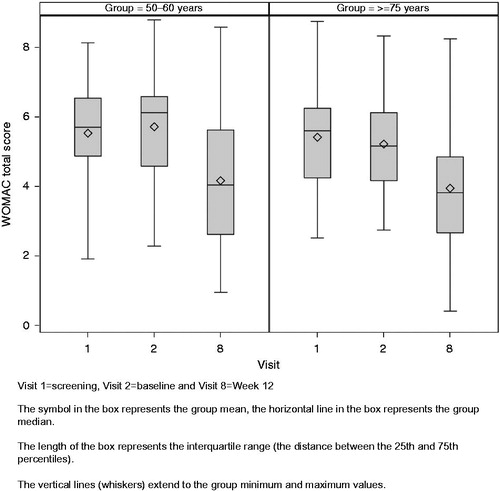
Table 3. Change from baseline to the last visit in WOMAC total score and subscale scores: full analysis population.
Table 4. EQ-5D dimension results at the last visit: full analysis population.
Table 5. Change from baseline to the last visit in EQ-5D VAS: full analysis population.
Figure 3. Mean number of nights with sleep disturbances due to pain in last 7 nights by visit: full analysis population.
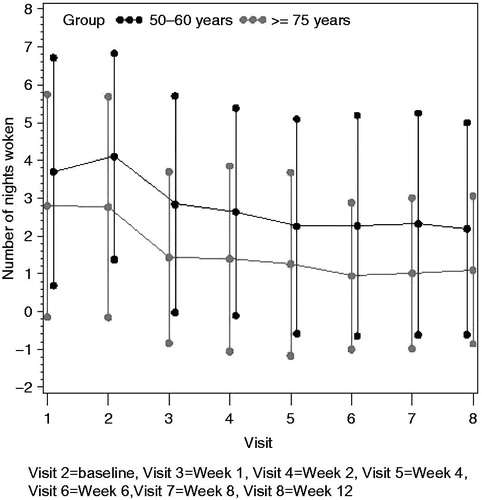
Table 6. Patients’ and Investigators’ Global Assessment of Pain Relief at the last visit: full analysis population.
Figure 4. Mean number of tablets of rescue medication taken per day by visit: full analysis population.
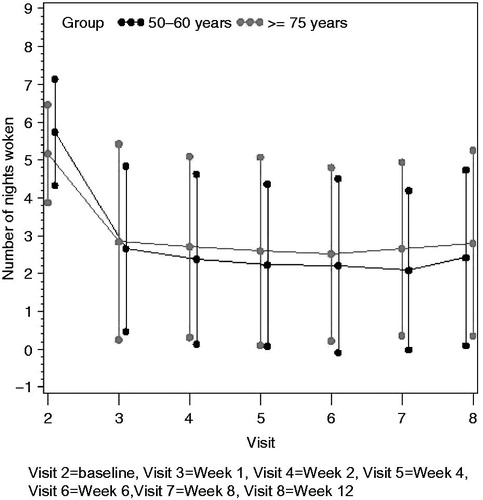
Table 7. Incidence of common adverse events by MedDRA system organ class and preferred term: safety population.