Figures & data
Figure 1. Sample selection (2010–2012 chart review). mRCC: metastatic renal cell carcinoma; TKI: tyrosine kinase inhibitor.
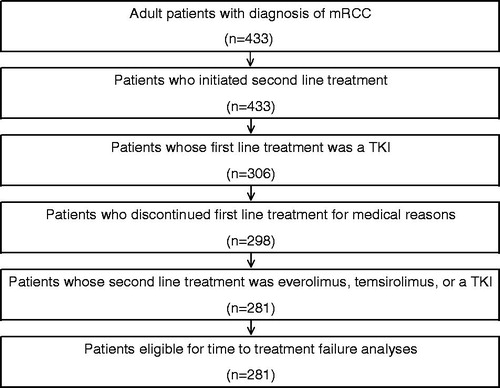
Table 1. Patient baseline characteristics (2010–2012 chart review study)a.
Table 2. Survival and follow-up time summary for second-line treatments in both (2009–2011 and 2010–2012) chart review studies.
Table 3. Adjusted comparisons of time to treatment failure and overall survival (2010–2012 chart review study)a,b.
Table 4. Multivariable Cox proportional hazards model for time to treatment failure (2010–2012 chart review).
Figure 2. Meta-analysis of targeted agent effects on time to treatment failure. Fixed-effects inverse variance weighting was performed to obtain the pooled hazard ratio for each comparison of time to treatment failure. TKIs in the 2009–2011 chart review included sorafenib only, while TKIs in the 2010–2012 chart review included sorafenib, sunitinib, pazopanib, and axitinib. TKI: tyrosine kinase inhibitor.
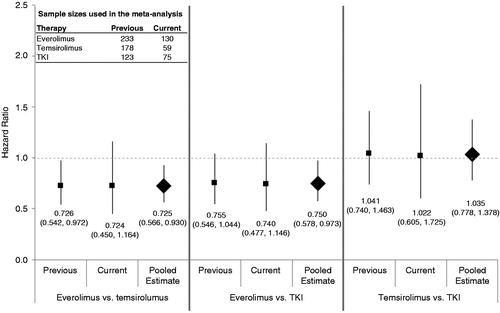
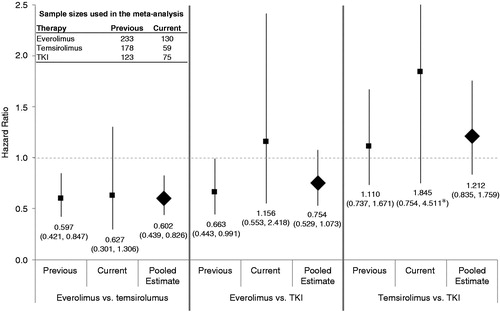
Figure 3. Meta-analysis of targeted agent effects on overall survival. Fixed-effects inverse variance weighting was performed to obtain the pooled hazard ratio for overall survival for everolimus vs. temsirolimus, everolimus vs. TKIs as a class, and temsirolimus vs. TKIs as a class. TKIs in the previous (2009–2011) dataset included sorafenib only, while TKIs in the current (2010–2012) dataset included sorafenib, sunitinib, pazopanib, and axitinib. Overall survival was defined as the time from the initiation of second targeted therapy to death from any cause. Patients without recorded death events during the study period were censored at the last follow-up date. *The upper bound of the 95% confidence interval for the hazard ratio for everolimus vs. TKI extends past the area of the graph and has been truncated for display purposes.