Figures & data
Table 1. Demographics in ileus and no ileus patients for open and laparoscopic colectomy and open and laparoscopic cholecystectomy.
Figure 1. Hospital length of stay in days for patients with ileus vs. no ileus is represented by the median for each surgical procedure.
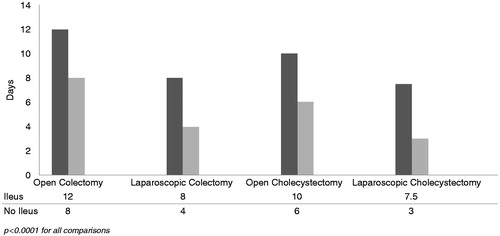
Figure 2. Total hospital cost in US dollars for patients with ileus vs. no ileus is represented by the median for each surgical procedure.
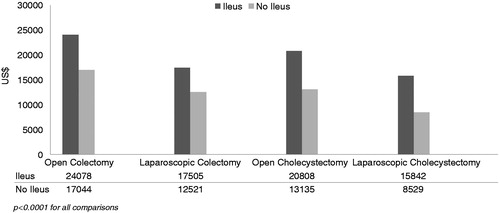
Figure 3. Thirty-day readmission rates for any cause for patients with ileus vs. no ileus are represented for each surgical procedure.
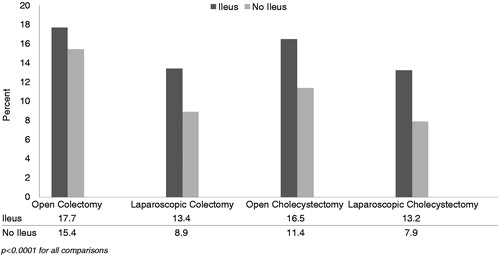
Figure 4. Total morphine equivalent dose in milligrams (mg) for patients with ileus vs no ileus is represented for each surgical procedure.
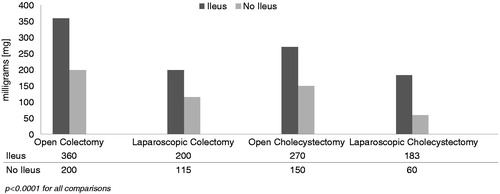
Figure 5. Hospital length of stay based on median morphine equivalent dose. Hospital length of stay in days for patients with ileus vs. no ileus is represented by the median for each surgical procedure. The median morphine dose for each surgical procedure appears in the data table.
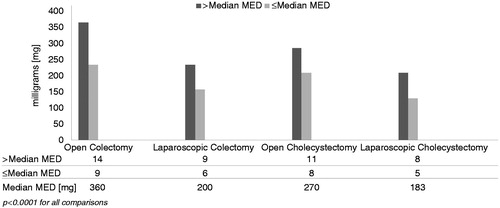
Figure 6. Total hospital costs based on median morphine equivalent dose. Total hospital cost in US dollars for patients with ileus vs. no ileus is represented by the median for each surgical procedure. The median morphine dose for each surgical procedure appears in the data table.
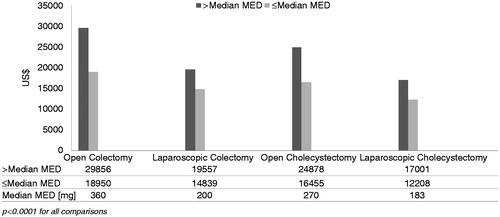
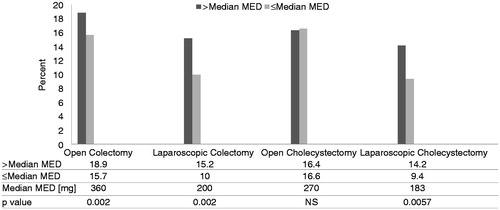
Figure 7. Thirty-day readmission rates based on median morphine equivalent dose. Thirty-day readmission rates for any cause for patients with ileus vs. no ileus are represented for each surgical procedure. The median morphine dose for each surgical procedure appears in the data table.