Figures & data
Figure 1. Patient disposition. aOne patient withdrew prior to administration of the study drug; hence, 402 patients were in the intent-to-treat and safety populations. bOne patient randomized to the SoluMatrix meloxicam 5 mg group received SoluMatrix meloxicam 10 mg and was recorded in the SoluMatrix meloxicam 10 mg group for analyses completed on the safety population, but remained in the 5 mg group for the analyses completed on the intent-to-treat population.
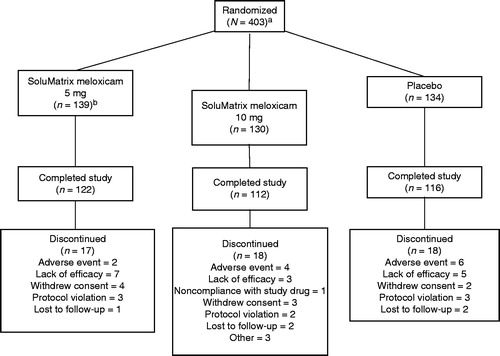
Table 1. Patient demographics and baseline characteristics.
Figure 2. Comparison of mean change from baseline in WOMAC pain subscale scores at weeks 2, 6, and 12 in patients with osteoarthritis. *P ≤ 0.024. †P = 0.1486. P values compared with placebo. All analyses are based on protocol-defined MMRM analysis (ITT population). ITT, intent-to-treat; LS, least squares; MMRM, mixed-model repeated measures; SE, standard error; WOMAC, Western Ontario and McMaster Universities Arthritis Index.
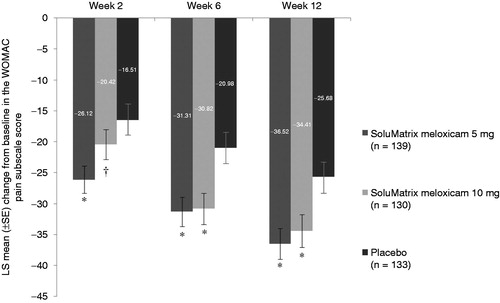
Table 2. Change in WOMAC pain subscale score from baseline comparison vs placebo at week 12 by MMRM and sensitivity analyses.
Figure 3. Comparison of mean change from baseline in the WOMAC (A) function and (B) stiffness subscale scores at weeks 2, 6, and 12 in patients with osteoarthritis. *P ≤ 0.0014. †P = 0.1065. ‡P ≤ 0.0379. P values compared with placebo. All analyses are based on protocol-defined MMRM analysis (ITT population). ITT, intent-to-treat; LS, least squares; MMRM, mixed-model repeated measures; SE, standard error; WOMAC, Western Ontario and McMaster Universities Arthritis Index.
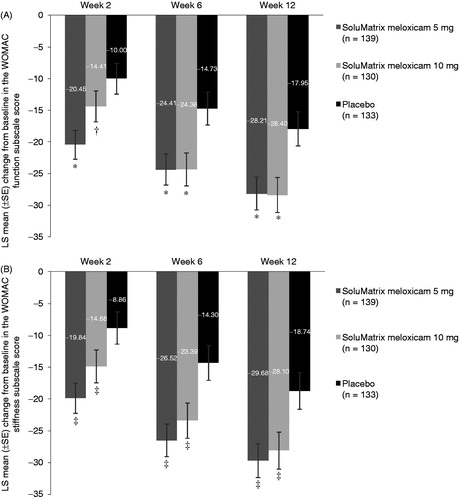
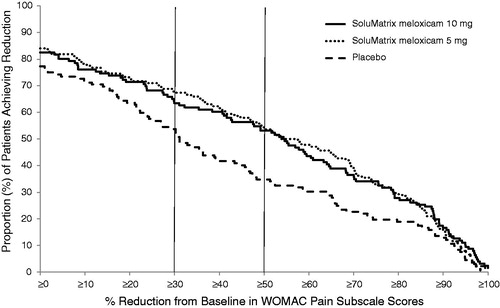
Figure 4. Continuous responder analysis of the WOMAC pain subscale scores at week 12 in patients with osteoarthritis.