Figures & data
Table 1. Demographics and baseline disease characteristics*.
Table 2. Efficacy outcomes at week 4 (LOCF/BOCF)*.
Figure 1. Daily NRS pain intensity: average daily pain during the last 24 hours at final visit, reported in the evening (last observation carried forward/baseline observation carried forward). NRS, numeric rating scale.
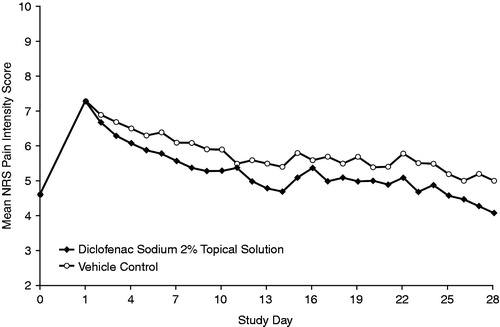
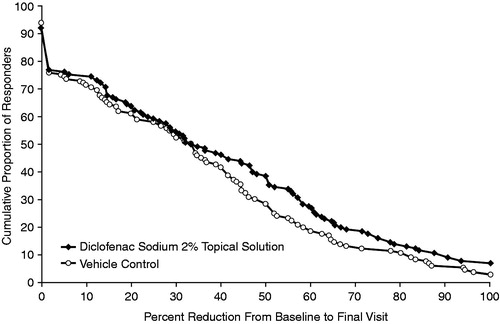
Figure 2. Cumulative proportion of responders from no response to 100% response using reduction in average numeric rating scale pain intensity ratings over the last 24 hours at final visit in the two treatment groups as measure of response (last observation carried forward/baseline observation carried forward).