Figures & data
Figure 1 Individual physical fitness by time point and study group. Individual performance output measured in W/kg bw at time points T1, T2 and T3, stratified by placebo group (Control group) and Ubiquinol group (Experimental group).
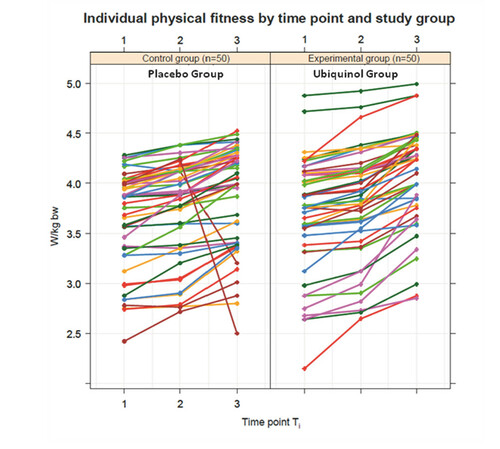
Figure 2 Mean Measured fitness by time point and study group. Progress of fitness (absolute values in W/kg bw and percentage values) at time points T1, T2 and T3 plotted as means and one standard deviation, stratified by study group.
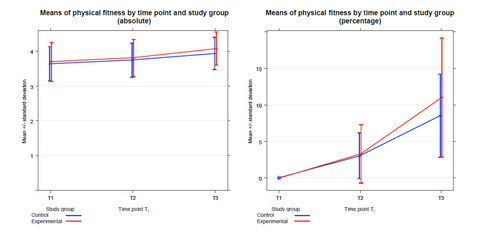
Table 1 Summary Statistics
Supplemental material